

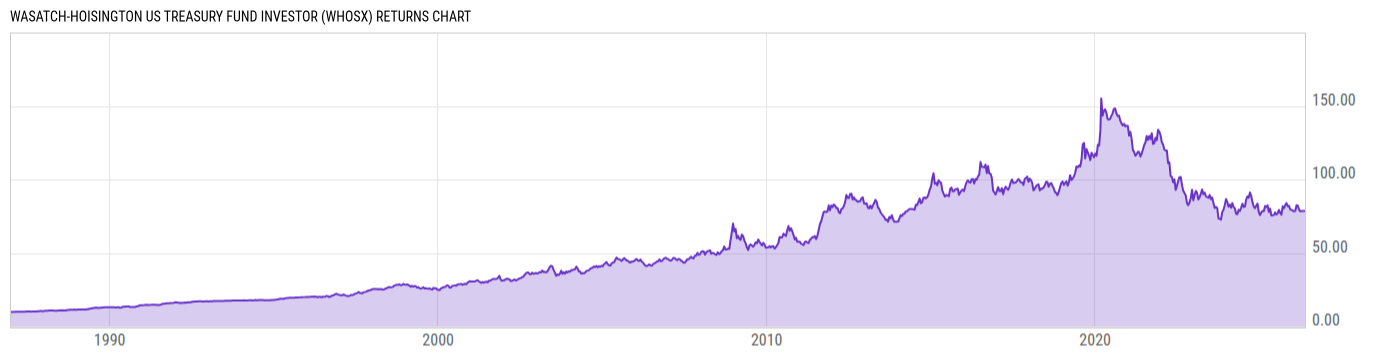
Wasatch-Hoisington US Treasury Fund Investor (WHOSX)
9.96
0.00 (0.00%)
USD |
May 22 2026
Returns Chart
Key Stats
| Net Expense Ratio | Total Assets Under Management | Weighted Average Dividend Yield | Turnover Ratio (Generic) |
|---|---|---|---|
| 0.73% | 112.51M | -- | 4.00% |
| 1 Year Fund Level Flows | 1 Year Total Returns (Daily) | Annualized Total Returns Since Inception (Daily) | Max Drawdown (Since Inception) |
| -31.08M | 6.54% |
Basic Info
| Investment Strategy | |
| The Fund seeks to provide a rate of return that exceeds the rate of inflation over a business cycle by investing in US Treasury securities with an emphasis on income and capital appreciation. It invests at least 90% of its total assets in US Treasury securities and repurchase agreements collateralized by such securities. |
| General | |
| Security Type | Mutual Fund |
| Equity Style | -- |
| Broad Asset Class | Taxable Bond |
| Broad Category | Fixed Income |
| Global Peer Group | Bond USD Government |
| Peer Group | General U.S. Treasury Funds |
| Global Macro | Bond Government |
| US Macro | U.S. Government & Treasury Fixed Income Funds |
| YCharts Categorization | -- |
| YCharts Benchmark | -- |
| Prospectus Objective | General U.S. Treasury Funds |
| Fund Owner Firm Name | Wasatch |
| Broad Asset Class Benchmark Index | |
| ^BBUSATR | 100.0% |
Net Fund Flows Versus Peer Group
1 Month
% Rank:
71
-2.909B
Peer Group Low
2.398B
Peer Group High
1 Year
% Rank:
76
-31.08M
-5.449B
Peer Group Low
12.88B
Peer Group High
3 Months
% Rank:
81
-2.663B
Peer Group Low
5.602B
Peer Group High
3 Years
% Rank:
92
-6.947B
Peer Group Low
18.19B
Peer Group High
6 Months
% Rank:
86
-5.293B
Peer Group Low
8.056B
Peer Group High
5 Years
% Rank:
91
-2.141B
Peer Group Low
38.21B
Peer Group High
YTD
% Rank:
76
-4.248B
Peer Group Low
7.543B
Peer Group High
10 Years
% Rank:
99
-745.00M
Peer Group Low
38.82B
Peer Group High
Date Unavailable
Risk
Performance Versus Peer Group
Annual Total Returns Versus Peers
As of May 26, 2026.
Asset Allocation
As of March 31, 2026.
| Type | % Net |
|---|---|
| Cash | 2.64% |
| Stock | 0.00% |
| Bond | 98.06% |
| Convertible | 0.00% |
| Preferred | 0.00% |
| Other | -0.70% |
Top 5 Holdings
| Name | % Weight | Price | % Change |
|---|---|---|---|
| United States of America USGB 3.75 02/28/2033 FIX USD Government | 52.72% | 96.71 | 0.42% |
| United States of America USGB 3.375 02/29/2028 FIX USD Government | 22.80% | 98.89 | 0.12% |
| United States of America USGB 3.5 02/28/2031 FIX USD Government | 22.54% | 97.09 | 0.32% |
|
USD Cash
|
2.64% | -- | -- |
|
Other Assets less Liabilities
|
-0.70% | -- | -- |
Fees & Availability
| Fees | |
| Actual 12B-1 Fee | -- |
| Actual Management Fee | 0.50% |
| Administration Fee | 16.10K% |
| Maximum Front Load | -- |
| Maximum Deferred Load | -- |
| Maximum Redemption Fee | 2.00% |
| General Availability | |
| Available for Insurance Product | No |
| Available for RRSP | No |
| Purchase Details | |
| Open to New Investors |
|
| Minimum Initial Investment | 2000.00 None |
| Minimum Subsequent Investment | 100.00 None |
Basic Info
| Investment Strategy | |
| The Fund seeks to provide a rate of return that exceeds the rate of inflation over a business cycle by investing in US Treasury securities with an emphasis on income and capital appreciation. It invests at least 90% of its total assets in US Treasury securities and repurchase agreements collateralized by such securities. |
| General | |
| Security Type | Mutual Fund |
| Equity Style | -- |
| Broad Asset Class | Taxable Bond |
| Broad Category | Fixed Income |
| Global Peer Group | Bond USD Government |
| Peer Group | General U.S. Treasury Funds |
| Global Macro | Bond Government |
| US Macro | U.S. Government & Treasury Fixed Income Funds |
| YCharts Categorization | -- |
| YCharts Benchmark | -- |
| Prospectus Objective | General U.S. Treasury Funds |
| Fund Owner Firm Name | Wasatch |
| Broad Asset Class Benchmark Index | |
| ^BBUSATR | 100.0% |
Fundamentals
| General | |
| Distribution Yield | -- |
| Dividend Yield TTM (5-21-26) | 4.12% |
| 30-Day SEC Yield (3-31-26) | 4.05% |
| 7-Day SEC Yield | -- |
| Number of Holdings | 5 |
| Bond | |
| Yield to Maturity (3-31-26) | 4.01% |
| Effective Duration | 4.70 |
| Average Coupon | 3.61% |
| Calculated Average Quality | 2.00 |
| Effective Maturity | 5.294 |
| Nominal Maturity | 5.294 |
| Number of Bond Holdings | 3 |
As of March 31, 2026
Fund Details
| Key Dates | |
| Inception Date | 12/6/1986 |
| Last Annual Report Date | 9/30/2025 |
| Last Prospectus Date | 1/31/2026 |
| Attributes | |
| Index Fund | -- |
| Inverse Fund | No |
| Leveraged Fund | -- |
| Fund of Funds | No |
| Currency Hedged Fund | -- |
| Socially Responsible Fund | No |
Top Portfolio Holders
| Name | % Weight |
|---|---|
| Portfolio A | 5.00% |
| Portfolio B | 3.50% |
| Portfolio C | 2.25% |
Excel Add-In Codes
| Name: =YCI("M:WHOSX", "name") |
| Broad Asset Class: =YCI("M:WHOSX", "broad_asset_class") |
| Broad Category: =YCI("M:WHOSX", "broad_category_group") |
| Prospectus Objective: =YCI("M:WHOSX", "prospectus_objective") |
| To find the codes for any of our securities and financial metrics, see our Complete Excel Reference. |