

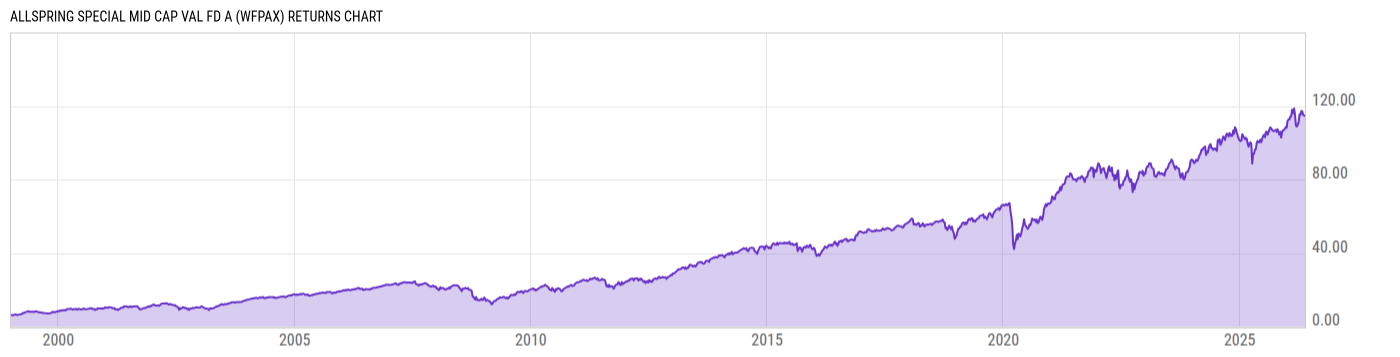
Allspring Special Mid Cap Val Fd A (WFPAX)
47.64
-0.70
(-1.45%)
USD |
Jun 10 2026
Returns Chart
Key Stats
| Net Expense Ratio | Total Assets Under Management | Weighted Average Dividend Yield | Turnover Ratio (Generic) |
|---|---|---|---|
| 1.12% | 13.10B | 1.38% | 38.00% |
| 1 Year Fund Level Flows | 1 Year Total Returns (Daily) | Annualized Total Returns Since Inception (Daily) | Max Drawdown (Since Inception) |
| -1.832B | 14.81% |
Basic Info
| Investment Strategy | |
| The Fund seeks capital growth by investing at least 65% of its assets in equity securities of medium capitalization companies the manager believes present attractive opportunities, but which have not been highly recognized by investment analysts or the financial press. |
| General | |
| Security Type | Mutual Fund |
| Equity Style | Mid Cap Core |
| Broad Asset Class | US Equity |
| Broad Category | Equity |
| Global Peer Group | Equity US Sm&Mid Cap |
| Peer Group | Mid-Cap Core Funds |
| Global Macro | Equity North America |
| US Macro | Mid-Cap Funds |
| YCharts Categorization | -- |
| YCharts Benchmark | -- |
| Prospectus Objective | Mid-Cap Funds |
| Fund Owner Firm Name | Allspring |
| Broad Asset Class Benchmark Index | |
| ^SPXTR | 100.0% |
Net Fund Flows Versus Peer Group
1 Month
% Rank:
92
-594.62M
Peer Group Low
2.049B
Peer Group High
1 Year
% Rank:
92
-1.832B
-4.551B
Peer Group Low
4.882B
Peer Group High
3 Months
% Rank:
94
-2.144B
Peer Group Low
2.770B
Peer Group High
3 Years
% Rank:
93
-7.475B
Peer Group Low
9.203B
Peer Group High
6 Months
% Rank:
92
-3.079B
Peer Group Low
3.341B
Peer Group High
5 Years
% Rank:
91
-10.52B
Peer Group Low
13.49B
Peer Group High
YTD
% Rank:
92
-2.431B
Peer Group Low
2.756B
Peer Group High
10 Years
% Rank:
56
-17.16B
Peer Group Low
26.12B
Peer Group High
Date Unavailable
Risk
Performance Versus Peer Group
Annual Total Returns Versus Peers
As of June 11, 2026.
Asset Allocation
As of April 30, 2026.
| Type | % Net |
|---|---|
| Cash | 1.68% |
| Stock | 97.13% |
| Bond | 1.16% |
| Convertible | 0.00% |
| Preferred | 0.00% |
| Other | 0.03% |
Top 10 Holdings
| Name | % Weight | Price | % Change |
|---|---|---|---|
| Keysight Technologies, Inc. | 3.83% | 340.05 | 4.95% |
| American Electric Power Co., Inc. | 3.38% | 128.42 | -0.09% |
| Qnity Electronics, Inc. | 3.03% | 148.73 | 6.43% |
| Baker Hughes Co. | 2.97% | 63.45 | 0.68% |
| Labcorp Holdings, Inc. | 2.91% | 265.21 | -1.27% |
| Church & Dwight Co., Inc. | 2.91% | 97.09 | -1.12% |
| ON Semiconductor Corp. | 2.88% | 115.92 | 5.22% |
| Allspring Govt Money Market Fund Sel | 2.82% | 1.00 | 0.00% |
| FirstEnergy Corp. | 2.75% | 46.66 | 0.48% |
| Republic Services, Inc. | 2.72% | 208.02 | -2.15% |
Fees & Availability
| Fees | |
| Actual 12B-1 Fee | -- |
| Actual Management Fee | 0.65% |
| Administration Fee | 2.76M% |
| Maximum Front Load | 5.75% |
| Maximum Deferred Load | -- |
| Maximum Redemption Fee | -- |
| General Availability | |
| Available for Insurance Product | -- |
| Available for RRSP | -- |
| Purchase Details | |
| Open to New Investors |
|
| Minimum Initial Investment | 1000.00 None |
| Minimum Subsequent Investment | 100.00 None |
Basic Info
| Investment Strategy | |
| The Fund seeks capital growth by investing at least 65% of its assets in equity securities of medium capitalization companies the manager believes present attractive opportunities, but which have not been highly recognized by investment analysts or the financial press. |
| General | |
| Security Type | Mutual Fund |
| Equity Style | Mid Cap Core |
| Broad Asset Class | US Equity |
| Broad Category | Equity |
| Global Peer Group | Equity US Sm&Mid Cap |
| Peer Group | Mid-Cap Core Funds |
| Global Macro | Equity North America |
| US Macro | Mid-Cap Funds |
| YCharts Categorization | -- |
| YCharts Benchmark | -- |
| Prospectus Objective | Mid-Cap Funds |
| Fund Owner Firm Name | Allspring |
| Broad Asset Class Benchmark Index | |
| ^SPXTR | 100.0% |
Fundamentals
| General | |
| Distribution Yield | -- |
| Dividend Yield TTM (6-10-26) | 0.76% |
| 30-Day SEC Yield | -- |
| 7-Day SEC Yield | -- |
| Number of Holdings | 68 |
| Stock | |
| Weighted Average PE Ratio | 29.28 |
| Weighted Average Price to Sales Ratio | 3.183 |
| Weighted Average Price to Book Ratio | 3.659 |
| Weighted Median ROE | 14.25% |
| Weighted Median ROA | 5.62% |
| ROI (TTM) | 8.54% |
| Return on Investment (TTM) | 8.54% |
| Earning Yield | 0.0472 |
| LT Debt / Shareholders Equity | 0.7815 |
| Number of Equity Holdings | 65 |
As of April 30, 2026
Growth Metrics
| EPS Growth (1Y) | 10.25% |
| EPS Growth (3Y) | -0.19% |
| EPS Growth (5Y) | 9.36% |
| Sales Growth (1Y) | 6.85% |
| Sales Growth (3Y) | 4.67% |
| Sales Growth (5Y) | 10.16% |
| Sales per Share Growth (1Y) | 6.87% |
| Sales per Share Growth (3Y) | 5.25% |
| Operating Cash Flow - Growth Rate (3Y) | 17.83% |
As of April 30, 2026
Fund Details
Top Portfolio Holders
| Name | % Weight |
|---|---|
| Portfolio A | 5.00% |
| Portfolio B | 3.50% |
| Portfolio C | 2.25% |
Excel Add-In Codes
| Name: =YCI("M:WFPAX", "name") |
| Broad Asset Class: =YCI("M:WFPAX", "broad_asset_class") |
| Broad Category: =YCI("M:WFPAX", "broad_category_group") |
| Prospectus Objective: =YCI("M:WFPAX", "prospectus_objective") |
| To find the codes for any of our securities and financial metrics, see our Complete Excel Reference. |