

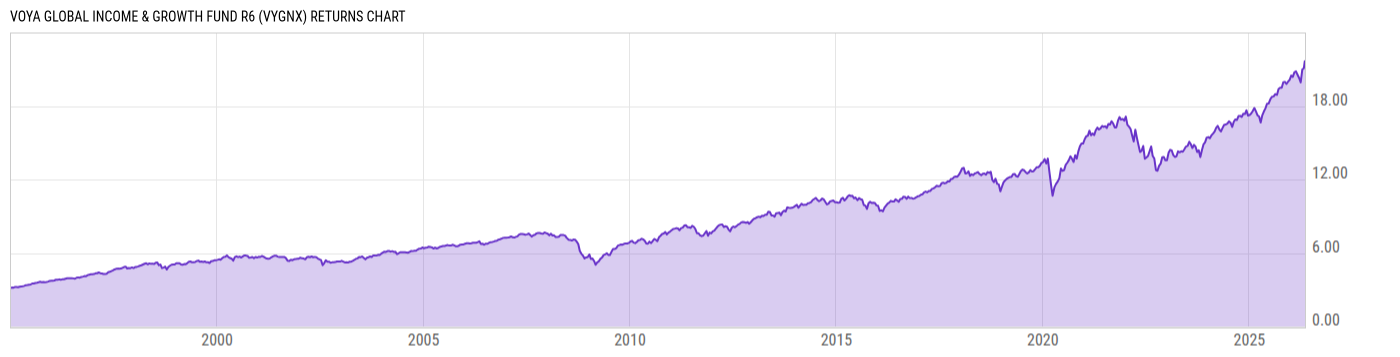
Voya Global Income & Growth Fund R6 (VYGNX)
13.47
+0.06
(+0.45%)
USD |
Jun 02 2026
Returns Chart
Key Stats
| Net Expense Ratio | Total Assets Under Management | Weighted Average Dividend Yield | Turnover Ratio (Generic) |
|---|---|---|---|
| 0.85% | 457.62M | 1.05% | 157.0% |
| 1 Year Fund Level Flows | 1 Year Total Returns (Daily) | Annualized Total Returns Since Inception (Daily) | Max Drawdown (Since Inception) |
| -53.51M | 21.21% |
Basic Info
| Investment Strategy | |
| The Fund seeks to provide total return consisting of capital growth, both realized and unrealized, and current income. The Fund invests its net assets across asset classes as follows: 33% in high-yield securities, 33% in convertible securities, and 33% in equity securities and/or written call options. |
| General | |
| Security Type | Mutual Fund |
| Equity Style | Large Cap Growth |
| Broad Asset Class | Allocation |
| Broad Category | Allocation |
| Global Peer Group | Mixed Asset USD Balanced - US |
| Peer Group | Mixed-Asset Target Alloc Moderate Funds |
| Global Macro | Mixed Asset HC Balanced |
| US Macro | Mixed-Assets Target Allocation Funds |
| YCharts Categorization | -- |
| YCharts Benchmark | -- |
| Prospectus Objective | Growth Funds |
| Fund Owner Firm Name | Voya |
| Broad Asset Class Benchmark Index | |
| ^SPXTR | 100.0% |
Net Fund Flows Versus Peer Group
1 Month
% Rank:
53
-325.86M
Peer Group Low
518.99M
Peer Group High
1 Year
% Rank:
46
-53.51M
-5.437B
Peer Group Low
642.22M
Peer Group High
3 Months
% Rank:
44
-1.193B
Peer Group Low
97.62M
Peer Group High
3 Years
% Rank:
41
-21.54B
Peer Group Low
3.106B
Peer Group High
6 Months
% Rank:
47
-3.694B
Peer Group Low
576.03M
Peer Group High
5 Years
% Rank:
40
-30.31B
Peer Group Low
2.725B
Peer Group High
YTD
% Rank:
47
-1.851B
Peer Group Low
585.46M
Peer Group High
10 Years
% Rank:
38
-51.28B
Peer Group Low
3.748B
Peer Group High
Date Unavailable
Risk
Performance Versus Peer Group
Annual Total Returns Versus Peers
As of June 03, 2026.
Asset Allocation
As of April 30, 2026.
| Type | % Net |
|---|---|
| Cash | 3.23% |
| Stock | 32.12% |
| Bond | 62.28% |
| Convertible | 0.00% |
| Preferred | 1.30% |
| Other | 1.07% |
Top 10 Holdings
| Name | % Weight | Price | % Change |
|---|---|---|---|
| BlackRock Liquidity FedFund Institutional | 7.30% | 1.00 | 0.00% |
| Alphabet, Inc. | 2.08% | 359.86 | -0.55% |
| NVIDIA Corp. | 2.05% | 215.33 | -3.36% |
| Apple, Inc. | 1.57% | 310.43 | -1.51% |
| Amazon.com, Inc. | 1.13% | 248.38 | -3.17% |
| Millicom International Cellular S.A. MICC 7.375 04/02/2032 FIX USD Corporate 144A | 0.84% | 102.86 | -0.21% |
| Microsoft Corp. | 0.83% | 427.83 | -3.05% |
| Broadcom Inc. | 0.80% | 485.32 | 0.78% |
| Live Nation Entertainment, Inc. LNEINC 2.875 01/15/2030 FIX USD Corporate | 0.70% | 114.46 | -0.82% |
| Western Digital Corporation WDC 3.0 11/15/2028 FIX USD Corporate 144A | 0.69% | 1499.30 | 3.10% |
Fees & Availability
| Fees | |
| Actual 12B-1 Fee | -- |
| Actual Management Fee | 0.71% |
| Administration Fee | -- |
| Maximum Front Load | -- |
| Maximum Deferred Load | -- |
| Maximum Redemption Fee | -- |
| General Availability | |
| Available for Insurance Product | No |
| Available for RRSP | No |
| Purchase Details | |
| Open to New Investors |
|
| Minimum Initial Investment | 1.00M None |
| Minimum Subsequent Investment | 0.00 None |
Basic Info
| Investment Strategy | |
| The Fund seeks to provide total return consisting of capital growth, both realized and unrealized, and current income. The Fund invests its net assets across asset classes as follows: 33% in high-yield securities, 33% in convertible securities, and 33% in equity securities and/or written call options. |
| General | |
| Security Type | Mutual Fund |
| Equity Style | Large Cap Growth |
| Broad Asset Class | Allocation |
| Broad Category | Allocation |
| Global Peer Group | Mixed Asset USD Balanced - US |
| Peer Group | Mixed-Asset Target Alloc Moderate Funds |
| Global Macro | Mixed Asset HC Balanced |
| US Macro | Mixed-Assets Target Allocation Funds |
| YCharts Categorization | -- |
| YCharts Benchmark | -- |
| Prospectus Objective | Growth Funds |
| Fund Owner Firm Name | Voya |
| Broad Asset Class Benchmark Index | |
| ^SPXTR | 100.0% |
Fundamentals
| General | |
| Distribution Yield | -- |
| Dividend Yield TTM (6-1-26) | 6.06% |
| 30-Day SEC Yield (4-30-26) | 2.08% |
| 7-Day SEC Yield (1-31-20) | 2.57% |
| Number of Holdings | 318 |
| Stock | |
| Weighted Average PE Ratio | 33.23 |
| Weighted Average Price to Sales Ratio | 8.101 |
| Weighted Average Price to Book Ratio | 10.30 |
| Weighted Median ROE | 35.46% |
| Weighted Median ROA | 15.39% |
| ROI (TTM) | 22.46% |
| Return on Investment (TTM) | 22.46% |
| Earning Yield | 0.0384 |
| LT Debt / Shareholders Equity | 0.6618 |
| Number of Equity Holdings | 97 |
| Bond | |
| Yield to Maturity (4-30-26) | 0.87% |
| Effective Duration | -- |
| Average Coupon | 4.93% |
| Calculated Average Quality | 5.249 |
| Effective Maturity | 4.898 |
| Nominal Maturity | 4.910 |
| Number of Bond Holdings | 195 |
As of April 30, 2026
Growth Metrics
| EPS Growth (1Y) | 27.03% |
| EPS Growth (3Y) | 19.71% |
| EPS Growth (5Y) | 26.92% |
| Sales Growth (1Y) | 12.07% |
| Sales Growth (3Y) | 14.49% |
| Sales Growth (5Y) | 14.25% |
| Sales per Share Growth (1Y) | 12.92% |
| Sales per Share Growth (3Y) | 15.20% |
| Operating Cash Flow - Growth Rate (3Y) | 26.90% |
As of April 30, 2026
Top Portfolio Holders
| Name | % Weight |
|---|---|
| Portfolio A | 5.00% |
| Portfolio B | 3.50% |
| Portfolio C | 2.25% |
Excel Add-In Codes
| Name: =YCI("M:VYGNX", "name") |
| Broad Asset Class: =YCI("M:VYGNX", "broad_asset_class") |
| Broad Category: =YCI("M:VYGNX", "broad_category_group") |
| Prospectus Objective: =YCI("M:VYGNX", "prospectus_objective") |
| To find the codes for any of our securities and financial metrics, see our Complete Excel Reference. |