

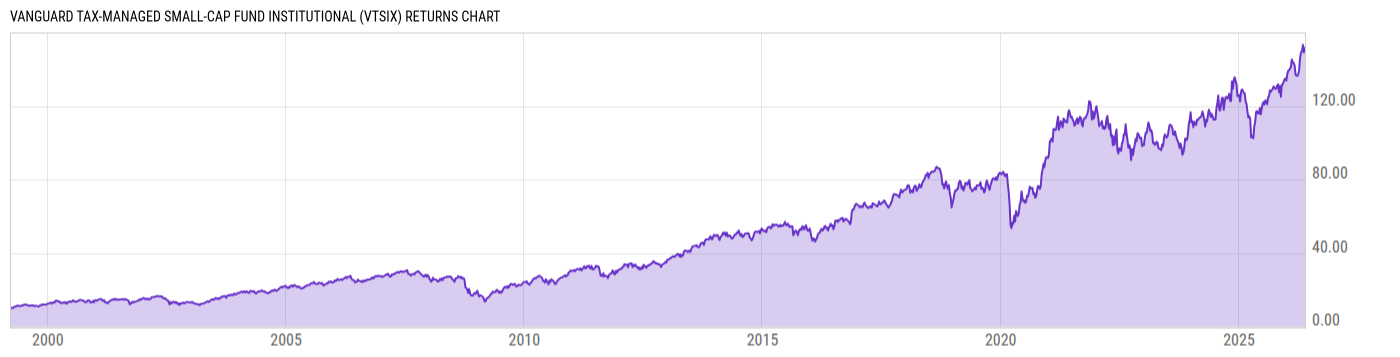
Vanguard Tax-Managed Small-Cap Fund Institutional (VTSIX)
112.61
+0.93
(+0.83%)
USD |
May 22 2026
Returns Chart
Key Stats
| Net Expense Ratio | Total Assets Under Management | Weighted Average Dividend Yield | Turnover Ratio (Generic) |
|---|---|---|---|
| 0.03% | 9.647B | 1.60% | 18.00% |
| 1 Year Fund Level Flows | 1 Year Total Returns (Daily) | Annualized Total Returns Since Inception (Daily) | Max Drawdown (Since Inception) |
| -550.03M | 33.50% |
Basic Info
| Investment Strategy | |
| The Fund seeks long-term growth of capital by investing primarily in equity securities included in Standard & Poor's Small-Cap 600 Index. |
| General | |
| Security Type | Mutual Fund |
| Equity Style | Small Cap Core |
| Broad Asset Class | US Equity |
| Broad Category | Equity |
| Global Peer Group | Equity US Sm&Mid Cap |
| Peer Group | Small-Cap Core Funds |
| Global Macro | Equity North America |
| US Macro | Small-Cap Funds |
| YCharts Categorization | -- |
| YCharts Benchmark | -- |
| Prospectus Objective | Small-Cap Funds |
| Fund Owner Firm Name | Vanguard |
| Broad Asset Class Benchmark Index | |
| ^SPXTR | 100.0% |
Net Fund Flows Versus Peer Group
1 Month
% Rank:
94
-3.545B
Peer Group Low
964.65M
Peer Group High
1 Year
% Rank:
92
-550.03M
-7.059B
Peer Group Low
2.156B
Peer Group High
3 Months
% Rank:
90
-2.361B
Peer Group Low
1.458B
Peer Group High
3 Years
% Rank:
90
-5.254B
Peer Group Low
6.142B
Peer Group High
6 Months
% Rank:
90
-3.339B
Peer Group Low
2.633B
Peer Group High
5 Years
% Rank:
86
-8.053B
Peer Group Low
8.240B
Peer Group High
YTD
% Rank:
87
-6.130B
Peer Group Low
1.873B
Peer Group High
10 Years
% Rank:
51
-10.58B
Peer Group Low
29.64B
Peer Group High
Date Unavailable
Risk
Performance Versus Peer Group
Annual Total Returns Versus Peers
As of May 25, 2026.
Asset Allocation
As of March 31, 2026.
| Type | % Net |
|---|---|
| Cash | 0.03% |
| Stock | 99.81% |
| Bond | 0.00% |
| Convertible | 0.00% |
| Preferred | 0.00% |
| Other | 0.16% |
Top 10 Holdings
| Name | % Weight | Price | % Change |
|---|---|---|---|
| Sanmina Corp. | 0.71% | 246.44 | 5.15% |
| Viavi Solutions, Inc. | 0.70% | 49.51 | 1.08% |
| FormFactor, Inc. | 0.67% | 128.99 | 0.77% |
| Molina Healthcare, Inc. | 0.58% | 184.14 | 1.59% |
| Element Solutions, Inc. | 0.57% | 40.75 | 0.97% |
| Semtech Corp. | 0.56% | 156.78 | 7.00% |
| Eastman Chemical Co. | 0.54% | 74.12 | 1.27% |
| Lumen Technologies, Inc. (Louisiana) | 0.53% | 9.41 | -0.32% |
| Primoris Services Corp. | 0.53% | 117.55 | 6.86% |
| Argan, Inc. | 0.53% | 656.35 | 1.82% |
Fees & Availability
| Fees | |
| Actual 12B-1 Fee | -- |
| Actual Management Fee | 0.03% |
| Administration Fee | 529.0K% |
| Maximum Front Load | -- |
| Maximum Deferred Load | -- |
| Maximum Redemption Fee | 0.00% |
| General Availability | |
| Available for Insurance Product | No |
| Available for RRSP | No |
| Purchase Details | |
| Open to New Investors |
|
| Minimum Initial Investment | 5.00M None |
| Minimum Subsequent Investment | 1.00 None |
Basic Info
| Investment Strategy | |
| The Fund seeks long-term growth of capital by investing primarily in equity securities included in Standard & Poor's Small-Cap 600 Index. |
| General | |
| Security Type | Mutual Fund |
| Equity Style | Small Cap Core |
| Broad Asset Class | US Equity |
| Broad Category | Equity |
| Global Peer Group | Equity US Sm&Mid Cap |
| Peer Group | Small-Cap Core Funds |
| Global Macro | Equity North America |
| US Macro | Small-Cap Funds |
| YCharts Categorization | -- |
| YCharts Benchmark | -- |
| Prospectus Objective | Small-Cap Funds |
| Fund Owner Firm Name | Vanguard |
| Broad Asset Class Benchmark Index | |
| ^SPXTR | 100.0% |
Fundamentals
| General | |
| Distribution Yield | -- |
| Dividend Yield TTM (5-21-26) | 1.19% |
| 30-Day SEC Yield (4-30-26) | 1.61% |
| 7-Day SEC Yield | -- |
| Number of Holdings | 605 |
| Stock | |
| Weighted Average PE Ratio | 25.09 |
| Weighted Average Price to Sales Ratio | 3.224 |
| Weighted Average Price to Book Ratio | 3.524 |
| Weighted Median ROE | 10.56% |
| Weighted Median ROA | 4.47% |
| ROI (TTM) | 7.60% |
| Return on Investment (TTM) | 7.60% |
| Earning Yield | 0.0599 |
| LT Debt / Shareholders Equity | 1.141 |
| Number of Equity Holdings | 603 |
As of March 31, 2026
Growth Metrics
| EPS Growth (1Y) | 17.65% |
| EPS Growth (3Y) | 5.71% |
| EPS Growth (5Y) | 11.04% |
| Sales Growth (1Y) | 10.61% |
| Sales Growth (3Y) | 7.36% |
| Sales Growth (5Y) | 11.48% |
| Sales per Share Growth (1Y) | 9.08% |
| Sales per Share Growth (3Y) | 7.20% |
| Operating Cash Flow - Growth Rate (3Y) | 22.94% |
As of March 31, 2026
Fund Details
| Key Dates | |
| Inception Date | 4/21/1999 |
| Last Annual Report Date | 12/31/2025 |
| Last Prospectus Date | 2/2/2026 |
| Share Classes | |
| VTMSX | Admiral |
| Attributes | |
| Index Fund | -- |
| Inverse Fund | No |
| Leveraged Fund | -- |
| Fund of Funds | No |
| Currency Hedged Fund | -- |
| Socially Responsible Fund | No |
Top Portfolio Holders
| Name | % Weight |
|---|---|
| Portfolio A | 5.00% |
| Portfolio B | 3.50% |
| Portfolio C | 2.25% |
Excel Add-In Codes
| Name: =YCI("M:VTSIX", "name") |
| Broad Asset Class: =YCI("M:VTSIX", "broad_asset_class") |
| Broad Category: =YCI("M:VTSIX", "broad_category_group") |
| Prospectus Objective: =YCI("M:VTSIX", "prospectus_objective") |
| To find the codes for any of our securities and financial metrics, see our Complete Excel Reference. |