

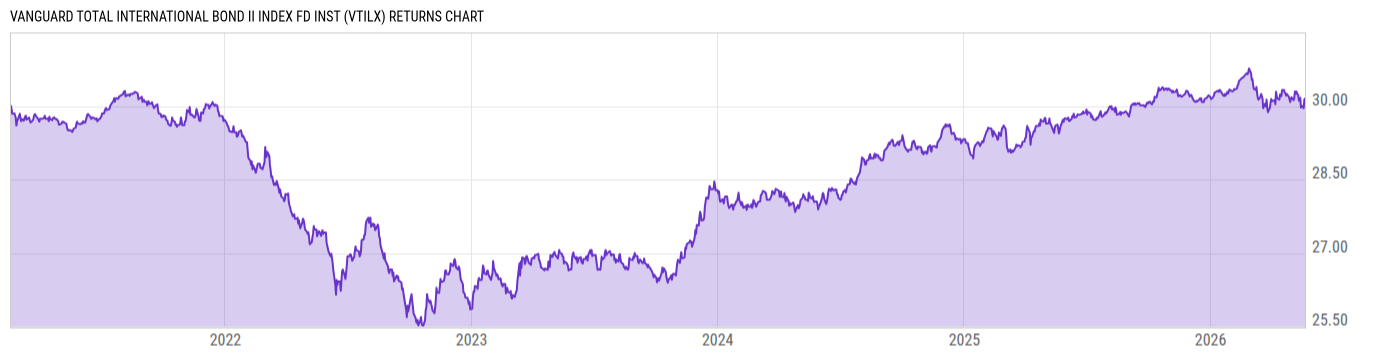
Vanguard Total International Bond II Index Fd Inst (VTILX)
25.84
+0.05
(+0.19%)
USD |
May 22 2026
Returns Chart
Key Stats
| Net Expense Ratio | Total Assets Under Management | Weighted Average Dividend Yield | Turnover Ratio (Generic) |
|---|---|---|---|
| 0.07% | 144.11B | -- | 25.00% |
| 1 Year Fund Level Flows | 1 Year Total Returns (Daily) | Annualized Total Returns Since Inception (Daily) | Max Drawdown (Since Inception) |
| 14.96B | 2.47% |
Basic Info
| Investment Strategy | |
| The Fund seeks to track the performance of a benchmark index that measures the investment return of non-U.S. dollar-denominated investment-grade bonds. Under normal circumstances, at least 80% of the Funds assets will be invested in bonds included in the Index and investments will be selected through sampling process. |
| General | |
| Security Type | Mutual Fund |
| Equity Style | -- |
| Broad Asset Class | Taxable Bond |
| Broad Category | Fixed Income |
| Global Peer Group | Bond Global USD |
| Peer Group | International Income Funds |
| Global Macro | Bond Global |
| US Macro | World Income Funds |
| YCharts Categorization | -- |
| YCharts Benchmark | -- |
| Prospectus Objective | International Income Funds |
| Fund Owner Firm Name | Vanguard |
| Broad Asset Class Benchmark Index | |
| ^BBUSATR | 100.0% |
Net Fund Flows Versus Peer Group
1 Month
% Rank:
100
-627.55M
Peer Group Low
1.614B
Peer Group High
1 Year
% Rank:
8
14.96B
-351876.0
Peer Group Low
16.79B
Peer Group High
3 Months
% Rank:
3
-31.12M
Peer Group Low
9.985B
Peer Group High
3 Years
% Rank:
3
-187.87M
Peer Group Low
34.15B
Peer Group High
6 Months
% Rank:
3
-68.41M
Peer Group Low
12.79B
Peer Group High
5 Years
% Rank:
3
-9.035B
Peer Group Low
104.64B
Peer Group High
YTD
% Rank:
3
-25.52M
Peer Group Low
9.985B
Peer Group High
10 Years
% Rank:
3
-5.060B
Peer Group Low
141.48B
Peer Group High
Date Unavailable
Risk
Performance Versus Peer Group
Annual Total Returns Versus Peers
As of May 24, 2026.
Asset Allocation
As of March 31, 2026.
| Type | % Net |
|---|---|
| Cash | 0.51% |
| Stock | 0.00% |
| Bond | 97.54% |
| Convertible | 0.00% |
| Preferred | 0.00% |
| Other | 1.95% |
Top 10 Holdings
| Name | % Weight | Price | % Change |
|---|---|---|---|
|
EUR/USD Forward Contract
|
15.10% | -- | -- |
|
CAD/USD Forward Contract
|
6.53% | -- | -- |
|
AUD/USD Forward Contract
|
3.66% | -- | -- |
|
GBP/USD Forward Contract
|
2.48% | -- | -- |
|
Vanguard Market Liquidity Fund
|
2.04% | -- | -- |
|
CHF/USD Forward Contract
|
0.93% | -- | -- |
|
DKK/USD Forward Contract
|
0.52% | -- | -- |
|
MXN/USD Forward Contract
|
0.47% | -- | -- |
|
France, Republic of (Government) .75% 25-NOV-2028
|
0.47% | -- | -- |
|
United Kingdom of Great Britain and Northern Ireland (Government) 4.125% 22-JUL-2029
|
0.44% | -- | -- |
Fees & Availability
| Fees | |
| Actual 12B-1 Fee | -- |
| Actual Management Fee | 0.06% |
| Administration Fee | 63.14M% |
| Maximum Front Load | -- |
| Maximum Deferred Load | -- |
| Maximum Redemption Fee | -- |
| General Availability | |
| Available for Insurance Product | No |
| Available for RRSP | No |
| Purchase Details | |
| Open to New Investors |
|
| Minimum Initial Investment | 5.00M None |
| Minimum Subsequent Investment | 1.00 None |
Basic Info
| Investment Strategy | |
| The Fund seeks to track the performance of a benchmark index that measures the investment return of non-U.S. dollar-denominated investment-grade bonds. Under normal circumstances, at least 80% of the Funds assets will be invested in bonds included in the Index and investments will be selected through sampling process. |
| General | |
| Security Type | Mutual Fund |
| Equity Style | -- |
| Broad Asset Class | Taxable Bond |
| Broad Category | Fixed Income |
| Global Peer Group | Bond Global USD |
| Peer Group | International Income Funds |
| Global Macro | Bond Global |
| US Macro | World Income Funds |
| YCharts Categorization | -- |
| YCharts Benchmark | -- |
| Prospectus Objective | International Income Funds |
| Fund Owner Firm Name | Vanguard |
| Broad Asset Class Benchmark Index | |
| ^BBUSATR | 100.0% |
Fundamentals
| General | |
| Distribution Yield | -- |
| Dividend Yield TTM (5-21-26) | 4.36% |
| 30-Day SEC Yield (4-30-26) | 3.50% |
| 7-Day SEC Yield | -- |
| Number of Holdings | 7140 |
| Bond | |
| Yield to Maturity (3-31-26) | 3.55% |
| Effective Duration | 6.70 |
| Average Coupon | 2.74% |
| Calculated Average Quality | 2.332 |
| Effective Maturity | 8.665 |
| Nominal Maturity | 8.838 |
| Number of Bond Holdings | 7070 |
As of March 31, 2026
Fund Details
| Key Dates | |
| Inception Date | 2/17/2021 |
| Last Annual Report Date | 10/31/2025 |
| Last Prospectus Date | 2/28/2025 |
| Share Classes | |
| VTIIX | Inv |
| Attributes | |
| Index Fund |
|
| Inverse Fund | No |
| Leveraged Fund | -- |
| Fund of Funds | No |
| Currency Hedged Fund | -- |
| Socially Responsible Fund | No |
Top Portfolio Holders
| Name | % Weight |
|---|---|
| Portfolio A | 5.00% |
| Portfolio B | 3.50% |
| Portfolio C | 2.25% |
Excel Add-In Codes
| Name: =YCI("M:VTILX", "name") |
| Broad Asset Class: =YCI("M:VTILX", "broad_asset_class") |
| Broad Category: =YCI("M:VTILX", "broad_category_group") |
| Prospectus Objective: =YCI("M:VTILX", "prospectus_objective") |
| To find the codes for any of our securities and financial metrics, see our Complete Excel Reference. |