

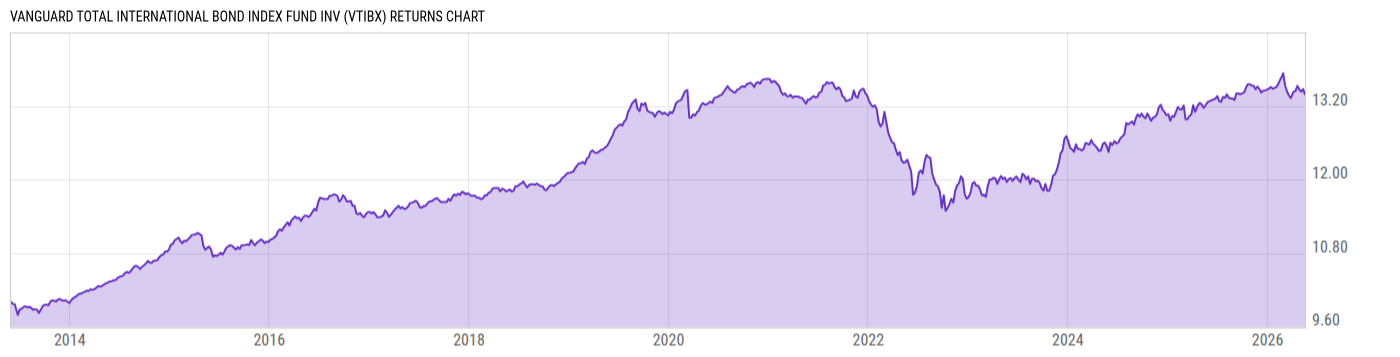
Vanguard Total International Bond Index Fund Inv (VTIBX)
9.58
-0.03
(-0.31%)
USD |
Jun 08 2026
Returns Chart
Key Stats
| Net Expense Ratio | Total Assets Under Management | Weighted Average Dividend Yield | Turnover Ratio (Generic) |
|---|---|---|---|
| 0.13% | 122.03B | -- | 23.00% |
| 1 Year Fund Level Flows | 1 Year Total Returns (Daily) | Annualized Total Returns Since Inception (Daily) | Max Drawdown (Since Inception) |
| 18.71B | 1.70% |
Basic Info
| Investment Strategy | |
| The Fund seeks to track the performance of an index that measures the investment return of non-US dollar-denominated investment-grade bonds. The Fund employs an indexing investment approach designed to track the performance of the Bloomberg Global Aggregate ex-USD Float Adjusted RIC Capped Index (USD Hedged). |
| General | |
| Security Type | Mutual Fund |
| Equity Style | -- |
| Broad Asset Class | Taxable Bond |
| Broad Category | Fixed Income |
| Global Peer Group | Bond Global USD |
| Peer Group | International Income Funds |
| Global Macro | Bond Global |
| US Macro | World Income Funds |
| YCharts Categorization | -- |
| YCharts Benchmark | -- |
| Prospectus Objective | International Income Funds |
| Fund Owner Firm Name | Vanguard |
| Broad Asset Class Benchmark Index | |
| ^BBUSATR | 100.0% |
Net Fund Flows Versus Peer Group
1 Month
% Rank:
4
-46.92M
Peer Group Low
2.992B
Peer Group High
1 Year
% Rank:
7
18.71B
-26.42M
Peer Group Low
20.29B
Peer Group High
3 Months
% Rank:
4
-150.34M
Peer Group Low
5.047B
Peer Group High
3 Years
% Rank:
7
-184.88M
Peer Group Low
36.94B
Peer Group High
6 Months
% Rank:
7
-79.22M
Peer Group Low
15.00B
Peer Group High
5 Years
% Rank:
8
-818.84M
Peer Group Low
80.02B
Peer Group High
YTD
% Rank:
7
-36.95M
Peer Group Low
13.80B
Peer Group High
10 Years
% Rank:
7
-5.018B
Peer Group Low
145.29B
Peer Group High
Date Unavailable
Risk
Performance Versus Peer Group
Annual Total Returns Versus Peers
As of June 09, 2026.
Asset Allocation
As of April 30, 2026.
| Type | % Net |
|---|---|
| Cash | 0.68% |
| Stock | 0.00% |
| Bond | 97.99% |
| Convertible | 0.00% |
| Preferred | 0.00% |
| Other | 1.33% |
Top 10 Holdings
| Name | % Weight | Price | % Change |
|---|---|---|---|
|
EUR/USD Forward Contract
|
15.24% | -- | -- |
|
CAD/USD Forward Contract
|
5.96% | -- | -- |
|
AUD/USD Forward Contract
|
3.76% | -- | -- |
|
GBP/USD Forward Contract
|
2.50% | -- | -- |
|
Vanguard Market Liquidity Fund
|
1.26% | -- | -- |
|
CHF/USD Forward Contract
|
0.89% | -- | -- |
|
DKK/USD Forward Contract
|
0.50% | -- | -- |
|
MXN/USD Forward Contract
|
0.48% | -- | -- |
|
ILS/USD Forward Contract
|
0.42% | -- | -- |
|
France, Republic of (Government) 2.7% 25-FEB-2031
|
0.40% | -- | -- |
Fees & Availability
| Fees | |
| Actual 12B-1 Fee | -- |
| Actual Management Fee | 0.08% |
| Administration Fee | 13.00K% |
| Maximum Front Load | -- |
| Maximum Deferred Load | -- |
| Maximum Redemption Fee | -- |
| General Availability | |
| Available for Insurance Product | No |
| Available for RRSP | No |
| Purchase Details | |
| Open to New Investors |
|
| Minimum Initial Investment | 0.00 None |
| Minimum Subsequent Investment | 0.00 None |
Basic Info
| Investment Strategy | |
| The Fund seeks to track the performance of an index that measures the investment return of non-US dollar-denominated investment-grade bonds. The Fund employs an indexing investment approach designed to track the performance of the Bloomberg Global Aggregate ex-USD Float Adjusted RIC Capped Index (USD Hedged). |
| General | |
| Security Type | Mutual Fund |
| Equity Style | -- |
| Broad Asset Class | Taxable Bond |
| Broad Category | Fixed Income |
| Global Peer Group | Bond Global USD |
| Peer Group | International Income Funds |
| Global Macro | Bond Global |
| US Macro | World Income Funds |
| YCharts Categorization | -- |
| YCharts Benchmark | -- |
| Prospectus Objective | International Income Funds |
| Fund Owner Firm Name | Vanguard |
| Broad Asset Class Benchmark Index | |
| ^BBUSATR | 100.0% |
Fundamentals
| General | |
| Distribution Yield | -- |
| Dividend Yield TTM (6-5-26) | 4.45% |
| 30-Day SEC Yield (5-31-26) | 3.38% |
| 7-Day SEC Yield | -- |
| Number of Holdings | 6748 |
| Bond | |
| Yield to Maturity (4-30-26) | 3.56% |
| Effective Duration | 6.70 |
| Average Coupon | 2.77% |
| Calculated Average Quality | 2.339 |
| Effective Maturity | 8.606 |
| Nominal Maturity | 8.785 |
| Number of Bond Holdings | 6677 |
As of April 30, 2026
Fund Details
Top Portfolio Holders
| Name | % Weight |
|---|---|
| Portfolio A | 5.00% |
| Portfolio B | 3.50% |
| Portfolio C | 2.25% |
Excel Add-In Codes
| Name: =YCI("M:VTIBX", "name") |
| Broad Asset Class: =YCI("M:VTIBX", "broad_asset_class") |
| Broad Category: =YCI("M:VTIBX", "broad_category_group") |
| Prospectus Objective: =YCI("M:VTIBX", "prospectus_objective") |
| To find the codes for any of our securities and financial metrics, see our Complete Excel Reference. |