

VALIC Company International Opportunities Fund (VIOPX)
17.83
+0.04
(+0.22%)
USD |
Jun 09 2026
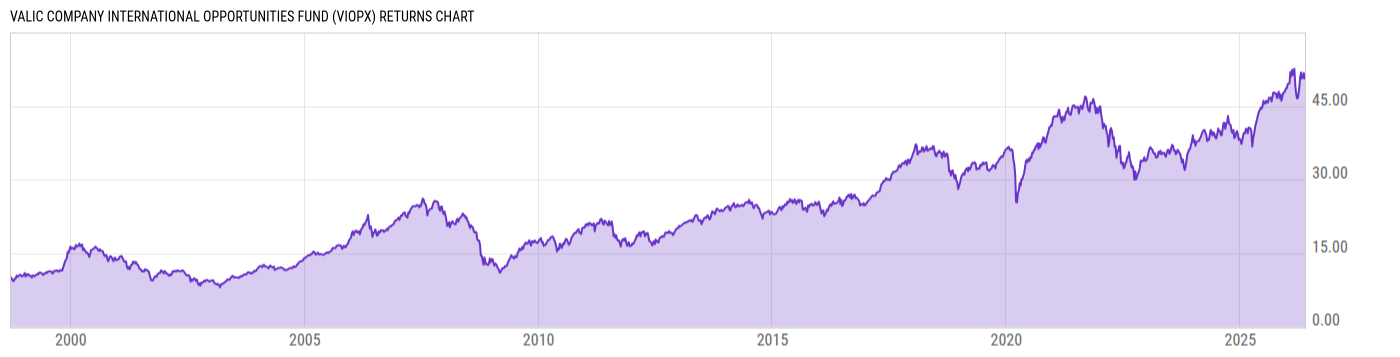
Returns Chart
Key Stats
| Net Expense Ratio | Total Assets Under Management | Weighted Average Dividend Yield | Turnover Ratio (Generic) |
|---|---|---|---|
| 1.01% | 287.71M | 2.47% | 61.00% |
| 1 Year Fund Level Flows | 1 Year Total Returns (Daily) | Annualized Total Returns Since Inception (Daily) | Max Drawdown (Since Inception) |
| -90.06M | 13.09% |
Basic Info
| Investment Strategy | |
| The Fund seeks to provide long-term capital appreciation through equity and equity-related investments in small capitalization companies outside the United States. At least 80% of the Fund's net assets will be invested in equity and equity-related securities of small cap companies throughout the world, excluding the U.S. |
| General | |
| Security Type | Insurance Fund |
| Equity Style | Mid Cap Growth |
| Broad Asset Class | International Equity |
| Broad Category | Equity |
| Global Peer Group | Equity Global ex US Sm&Mid Cap |
| Peer Group | International Small/Mid-Cap Growth |
| Global Macro | Equity Global |
| US Macro | Developed International Markets Funds |
| YCharts Categorization | -- |
| YCharts Benchmark | -- |
| Prospectus Objective | International Small-Cap Funds |
| Fund Owner Firm Name | AIG |
| Broad Asset Class Benchmark Index | |
| ^MSACXUSNTR | 100.0% |
Net Fund Flows Versus Peer Group
1 Month
% Rank:
64
-390.68M
Peer Group Low
88.67M
Peer Group High
1 Year
% Rank:
68
-90.06M
-1.684B
Peer Group Low
623.20M
Peer Group High
3 Months
% Rank:
75
-669.09M
Peer Group Low
267.69M
Peer Group High
3 Years
% Rank:
60
-3.013B
Peer Group Low
354.39M
Peer Group High
6 Months
% Rank:
78
-831.12M
Peer Group Low
275.92M
Peer Group High
5 Years
% Rank:
61
-5.218B
Peer Group Low
393.52M
Peer Group High
YTD
% Rank:
78
-741.01M
Peer Group Low
272.93M
Peer Group High
10 Years
% Rank:
76
-8.652B
Peer Group Low
938.00M
Peer Group High
Date Unavailable
Risk
Performance Versus Peer Group
Annual Total Returns Versus Peers
As of June 10, 2026.
Asset Allocation
As of February 28, 2026.
| Type | % Net |
|---|---|
| Cash | 1.23% |
| Stock | 96.32% |
| Bond | 0.00% |
| Convertible | 0.00% |
| Preferred | 1.22% |
| Other | 1.23% |
Top 10 Holdings
| Name | % Weight | Price | % Change |
|---|---|---|---|
| iShares MSCI EAFE Small-Cap ETF | 1.17% | 83.82 | 0.14% |
| Partners Group Holding AG | 1.17% | 894.10 | -0.55% |
|
USD Cash
|
1.15% | -- | -- |
| Bunzl Plc | 1.11% | 31.00 | 0.00% |
| Arcadis NV | 1.08% | 40.68 | 0.45% |
| Azbil Corp. | 1.02% | 9.40 | 0.00% |
| IMI Plc | 0.97% | 36.75 | 0.00% |
| DISCO Corp. | 0.92% | 432.72 | 2.12% |
| Spirax Group Plc | 0.89% | 90.61 | 0.00% |
| Svenska Handelsbanken AB | 0.88% | 14.46 | 0.00% |
Fees & Availability
| Fees | |
| Actual 12B-1 Fee | -- |
| Actual Management Fee | 0.80% |
| Administration Fee | 257.8K% |
| Maximum Front Load | -- |
| Maximum Deferred Load | -- |
| Maximum Redemption Fee | -- |
| General Availability | |
| Available for Insurance Product |
|
| Available for RRSP | No |
| Purchase Details | |
| Open to New Investors |
|
| Minimum Initial Investment | 0.00 None |
| Minimum Subsequent Investment | 0.00 None |
Basic Info
| Investment Strategy | |
| The Fund seeks to provide long-term capital appreciation through equity and equity-related investments in small capitalization companies outside the United States. At least 80% of the Fund's net assets will be invested in equity and equity-related securities of small cap companies throughout the world, excluding the U.S. |
| General | |
| Security Type | Insurance Fund |
| Equity Style | Mid Cap Growth |
| Broad Asset Class | International Equity |
| Broad Category | Equity |
| Global Peer Group | Equity Global ex US Sm&Mid Cap |
| Peer Group | International Small/Mid-Cap Growth |
| Global Macro | Equity Global |
| US Macro | Developed International Markets Funds |
| YCharts Categorization | -- |
| YCharts Benchmark | -- |
| Prospectus Objective | International Small-Cap Funds |
| Fund Owner Firm Name | AIG |
| Broad Asset Class Benchmark Index | |
| ^MSACXUSNTR | 100.0% |
Fundamentals
| General | |
| Distribution Yield | -- |
| Dividend Yield TTM (6-8-26) | 3.50% |
| 30-Day SEC Yield | -- |
| 7-Day SEC Yield | -- |
| Number of Holdings | 344 |
| Stock | |
| Weighted Average PE Ratio | 25.36 |
| Weighted Average Price to Sales Ratio | 4.478 |
| Weighted Average Price to Book Ratio | 4.481 |
| Weighted Median ROE | 15.94% |
| Weighted Median ROA | 7.32% |
| ROI (TTM) | 11.37% |
| Return on Investment (TTM) | 11.37% |
| Earning Yield | 0.0521 |
| LT Debt / Shareholders Equity | 382.01 |
| Number of Equity Holdings | 320 |
As of February 28, 2026
Growth Metrics
| EPS Growth (1Y) | 12.44% |
| EPS Growth (3Y) | 10.86% |
| EPS Growth (5Y) | 13.07% |
| Sales Growth (1Y) | 9.12% |
| Sales Growth (3Y) | 9.15% |
| Sales Growth (5Y) | 10.41% |
| Sales per Share Growth (1Y) | 10.43% |
| Sales per Share Growth (3Y) | 9.47% |
| Operating Cash Flow - Growth Rate (3Y) | 18.96% |
As of February 28, 2026
Fund Details
| Key Dates | |
| Launch Date | 9/21/1998 |
| Last Annual Report Date | 5/31/2025 |
| Last Prospectus Date | 10/1/2025 |
| Attributes | |
| Index Fund | -- |
| Inverse Fund | No |
| Leveraged Fund | -- |
| Fund of Funds | No |
| Currency Hedged Fund | -- |
| Socially Responsible Fund | No |
Top Portfolio Holders
| Name | % Weight |
|---|---|
| Portfolio A | 5.00% |
| Portfolio B | 3.50% |
| Portfolio C | 2.25% |