

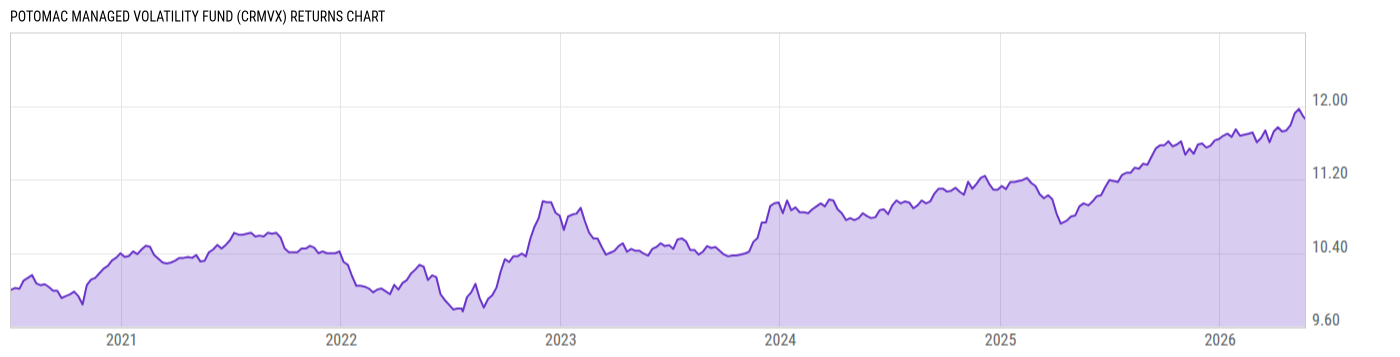
Potomac Managed Volatility Fund (CRMVX)
10.13
-0.01
(-0.10%)
USD |
May 22 2026
Returns Chart
Key Stats
| Net Expense Ratio | Total Assets Under Management | Weighted Average Dividend Yield | Turnover Ratio (Generic) |
|---|---|---|---|
| 1.66% | 226.10M | -- | 665.0% |
| 1 Year Fund Level Flows | 1 Year Total Returns (Daily) | Annualized Total Returns Since Inception (Daily) | Max Drawdown (Since Inception) |
| 56.90M | 9.20% |
Basic Info
| Investment Strategy | |
| The Fund seeks total return. The Fund invests in underlying funds which consists of exchange-traded funds, mutual funds and/or cash and cash equivalents, where the underlying funds generally invest in fixed income securities and equity securities domestic and international, including emerging markets. |
| General | |
| Security Type | Mutual Fund |
| Equity Style | -- |
| Broad Asset Class | Taxable Bond |
| Broad Category | Fixed Income |
| Global Peer Group | Bond USD |
| Peer Group | Multi-Sector Income Funds |
| Global Macro | Bond HC |
| US Macro | General Domestic Taxable Fixed Income Funds |
| YCharts Categorization | -- |
| YCharts Benchmark | -- |
| Prospectus Objective | Multi-Sector Income Funds |
| Fund Owner Firm Name | Potomac |
| Broad Asset Class Benchmark Index | |
| ^BBUSATR | 100.0% |
Net Fund Flows Versus Peer Group
1 Month
% Rank:
79
-750.55M
Peer Group Low
663.96M
Peer Group High
1 Year
% Rank:
43
56.90M
-1.542B
Peer Group Low
32.11B
Peer Group High
3 Months
% Rank:
42
-386.65M
Peer Group Low
4.786B
Peer Group High
3 Years
% Rank:
36
-4.565B
Peer Group Low
72.13B
Peer Group High
6 Months
% Rank:
44
-786.27M
Peer Group Low
14.99B
Peer Group High
5 Years
% Rank:
37
-7.515B
Peer Group Low
62.56B
Peer Group High
YTD
% Rank:
41
-509.21M
Peer Group Low
8.280B
Peer Group High
10 Years
% Rank:
49
-14.37B
Peer Group Low
117.81B
Peer Group High
Date Unavailable
Risk
Performance Versus Peer Group
Annual Total Returns Versus Peers
As of May 24, 2026.
Asset Allocation
As of March 31, 2026.
| Type | % Net |
|---|---|
| Cash | 66.32% |
| Stock | 0.00% |
| Bond | 22.19% |
| Convertible | 0.00% |
| Preferred | 0.00% |
| Other | 11.49% |
Top 6 Holdings
| Name | % Weight | Price | % Change |
|---|---|---|---|
|
Cash and Cash Equivalents
|
49.89% | -- | -- |
| Invesco Optimum Yld Dvsfd Cmd Str No K-1 ETF | 12.79% | 18.20 | -0.60% |
| iMGP DBi Managed Futures Strategy ETF | 12.50% | 31.09 | -0.06% |
| KraneShares Mount Lucas Managed Futures Ix Str ETF | 12.32% | 29.22 | 0.09% |
| Invesco DB US Dollar Index Bullish Fund | 12.29% | 27.77 | 0.14% |
|
Other Assets less Liabilities
|
0.22% | -- | -- |
Fees & Availability
| Fees | |
| Actual 12B-1 Fee | -- |
| Actual Management Fee | 1.19% |
| Administration Fee | 342.9K% |
| Maximum Front Load | -- |
| Maximum Deferred Load | -- |
| Maximum Redemption Fee | -- |
| General Availability | |
| Available for Insurance Product | No |
| Available for RRSP | No |
| Purchase Details | |
| Open to New Investors |
|
| Minimum Initial Investment | 5000.00 None |
| Minimum Subsequent Investment | 100.00 None |
Basic Info
| Investment Strategy | |
| The Fund seeks total return. The Fund invests in underlying funds which consists of exchange-traded funds, mutual funds and/or cash and cash equivalents, where the underlying funds generally invest in fixed income securities and equity securities domestic and international, including emerging markets. |
| General | |
| Security Type | Mutual Fund |
| Equity Style | -- |
| Broad Asset Class | Taxable Bond |
| Broad Category | Fixed Income |
| Global Peer Group | Bond USD |
| Peer Group | Multi-Sector Income Funds |
| Global Macro | Bond HC |
| US Macro | General Domestic Taxable Fixed Income Funds |
| YCharts Categorization | -- |
| YCharts Benchmark | -- |
| Prospectus Objective | Multi-Sector Income Funds |
| Fund Owner Firm Name | Potomac |
| Broad Asset Class Benchmark Index | |
| ^BBUSATR | 100.0% |
Fundamentals
| General | |
| Distribution Yield | -- |
| Dividend Yield TTM (5-21-26) | 4.26% |
| 30-Day SEC Yield | -- |
| 7-Day SEC Yield | -- |
| Number of Holdings | 6 |
Fund Details
| Key Dates | |
| Inception Date | 7/1/2020 |
| Last Annual Report Date | 6/30/2025 |
| Last Prospectus Date | 11/1/2025 |
| Attributes | |
| Index Fund | -- |
| Inverse Fund | No |
| Leveraged Fund | -- |
| Fund of Funds |
|
| Currency Hedged Fund | -- |
| Socially Responsible Fund | No |
Top Portfolio Holders
| Name | % Weight |
|---|---|
| Portfolio A | 5.00% |
| Portfolio B | 3.50% |
| Portfolio C | 2.25% |
Excel Add-In Codes
| Name: =YCI("M:CRMVX", "name") |
| Broad Asset Class: =YCI("M:CRMVX", "broad_asset_class") |
| Broad Category: =YCI("M:CRMVX", "broad_category_group") |
| Prospectus Objective: =YCI("M:CRMVX", "prospectus_objective") |
| To find the codes for any of our securities and financial metrics, see our Complete Excel Reference. |