

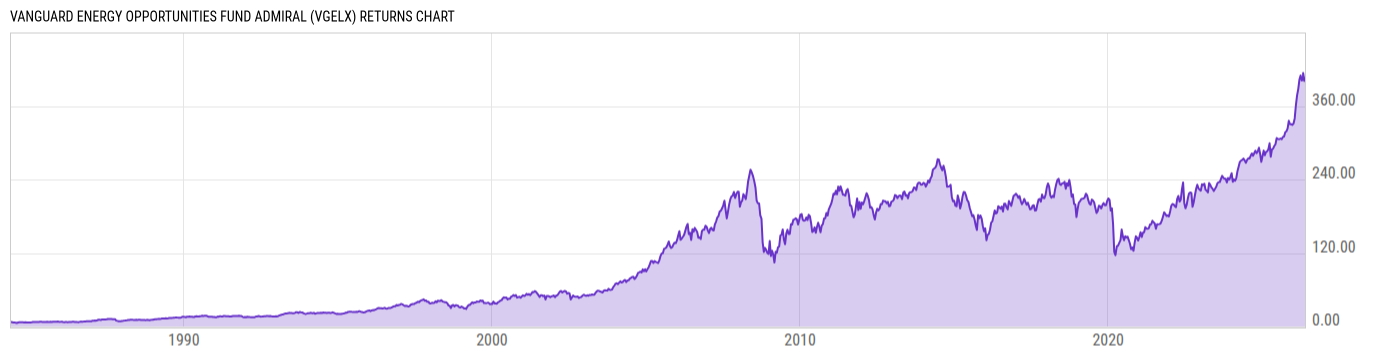
Vanguard Energy Opportunities Fund Admiral (VGELX)
110.87
+0.29
(+0.26%)
USD |
May 22 2026
Returns Chart
Key Stats
| Net Expense Ratio | Total Assets Under Management | Weighted Average Dividend Yield | Turnover Ratio (Generic) |
|---|---|---|---|
| 0.37% | 7.660B | 2.48% | 19.00% |
| 1 Year Fund Level Flows | 1 Year Total Returns (Daily) | Annualized Total Returns Since Inception (Daily) | Max Drawdown (Since Inception) |
| -264.75M | 38.58% |
Basic Info
| Investment Strategy | |
| The Fund seeks to provide long-term capital appreciation. The Fund invests at least 80% of its assets in common stocks of companies principally engaged in activities in the energy industry, such as the exploration, production, and transmission of energy or energy fuels; the making and servicing of component products, etc. |
| General | |
| Security Type | Mutual Fund |
| Equity Style | Large Cap Value |
| Broad Asset Class | Sector Equity |
| Broad Category | Equity |
| Global Peer Group | Equity Theme - Natural Resources |
| Peer Group | Global Natural Resources Funds |
| Global Macro | Equity Theme |
| US Macro | World Sector Equity Funds |
| YCharts Categorization | -- |
| YCharts Benchmark | -- |
| Prospectus Objective | Global Natural Resources Funds |
| Fund Owner Firm Name | Vanguard |
| Broad Asset Class Benchmark Index | |
| ^MSWNTR | 100.0% |
Net Fund Flows Versus Peer Group
1 Month
% Rank:
4
-127.20M
Peer Group Low
54.93M
Peer Group High
1 Year
% Rank:
93
-264.75M
-628.91M
Peer Group Low
711.16M
Peer Group High
3 Months
% Rank:
25
-42.34M
Peer Group Low
445.31M
Peer Group High
3 Years
% Rank:
98
-1.987B
Peer Group Low
2.675B
Peer Group High
6 Months
% Rank:
91
-212.99M
Peer Group Low
680.81M
Peer Group High
5 Years
% Rank:
100
-2.116B
Peer Group Low
2.675B
Peer Group High
YTD
% Rank:
27
-82.52M
Peer Group Low
566.00M
Peer Group High
10 Years
% Rank:
100
-6.590B
Peer Group Low
2.675B
Peer Group High
Date Unavailable
Risk
Performance Versus Peer Group
Annual Total Returns Versus Peers
As of May 25, 2026.
Asset Allocation
As of March 31, 2026.
| Type | % Net |
|---|---|
| Cash | 0.89% |
| Stock | 99.08% |
| Bond | 0.00% |
| Convertible | 0.00% |
| Preferred | 0.00% |
| Other | 0.02% |
Top 10 Holdings
| Name | % Weight | Price | % Change |
|---|---|---|---|
| Exxon Mobil Corp. | 9.52% | 154.92 | -0.24% |
| TotalEnergies SE | 7.10% | 91.60 | -0.81% |
| Shell Plc | 5.01% | 44.25 | 1.33% |
| ENGIE SA | 4.87% | 32.24 | -0.05% |
| Marathon Petroleum Corp. | 4.75% | 254.65 | 2.50% |
| Chevron Corp. | 4.29% | 191.43 | 0.22% |
| Shell Plc | 3.92% | 85.71 | -1.40% |
| Sempra | 3.79% | 92.80 | 1.37% |
| Targa Resources Corp. | 3.76% | 276.75 | 2.41% |
| The Williams Cos., Inc. | 3.67% | 78.47 | 1.23% |
Fees & Availability
| Fees | |
| Actual 12B-1 Fee | -- |
| Actual Management Fee | 0.35% |
| Administration Fee | 6.25M% |
| Maximum Front Load | -- |
| Maximum Deferred Load | -- |
| Maximum Redemption Fee | 0.00% |
| General Availability | |
| Available for Insurance Product | No |
| Available for RRSP | No |
| Purchase Details | |
| Open to New Investors |
|
| Minimum Initial Investment | 50000.00 None |
| Minimum Subsequent Investment | 1.00 None |
Basic Info
| Investment Strategy | |
| The Fund seeks to provide long-term capital appreciation. The Fund invests at least 80% of its assets in common stocks of companies principally engaged in activities in the energy industry, such as the exploration, production, and transmission of energy or energy fuels; the making and servicing of component products, etc. |
| General | |
| Security Type | Mutual Fund |
| Equity Style | Large Cap Value |
| Broad Asset Class | Sector Equity |
| Broad Category | Equity |
| Global Peer Group | Equity Theme - Natural Resources |
| Peer Group | Global Natural Resources Funds |
| Global Macro | Equity Theme |
| US Macro | World Sector Equity Funds |
| YCharts Categorization | -- |
| YCharts Benchmark | -- |
| Prospectus Objective | Global Natural Resources Funds |
| Fund Owner Firm Name | Vanguard |
| Broad Asset Class Benchmark Index | |
| ^MSWNTR | 100.0% |
Fundamentals
| General | |
| Distribution Yield | -- |
| Dividend Yield TTM (5-21-26) | 2.93% |
| 30-Day SEC Yield (4-30-26) | 2.79% |
| 7-Day SEC Yield | -- |
| Number of Holdings | 47 |
| Stock | |
| Weighted Average PE Ratio | 24.16 |
| Weighted Average Price to Sales Ratio | 2.772 |
| Weighted Average Price to Book Ratio | 3.299 |
| Weighted Median ROE | 13.22% |
| Weighted Median ROA | 4.58% |
| ROI (TTM) | 5.58% |
| Return on Investment (TTM) | 5.58% |
| Earning Yield | 0.0475 |
| LT Debt / Shareholders Equity | 0.9430 |
| Number of Equity Holdings | 40 |
As of March 31, 2026
Growth Metrics
| EPS Growth (1Y) | 2.96% |
| EPS Growth (3Y) | -2.55% |
| EPS Growth (5Y) | 21.93% |
| Sales Growth (1Y) | 3.82% |
| Sales Growth (3Y) | -3.08% |
| Sales Growth (5Y) | 11.67% |
| Sales per Share Growth (1Y) | 3.15% |
| Sales per Share Growth (3Y) | -2.24% |
| Operating Cash Flow - Growth Rate (3Y) | 3.69% |
As of March 31, 2026
Fund Details
| Key Dates | |
| Inception Date | 11/12/2001 |
| Last Annual Report Date | 1/31/2026 |
| Last Prospectus Date | 5/29/2025 |
| Share Classes | |
| VGENX | Inv |
| Attributes | |
| Index Fund | -- |
| Inverse Fund | No |
| Leveraged Fund | -- |
| Fund of Funds | No |
| Currency Hedged Fund | -- |
| Socially Responsible Fund | No |
Top Portfolio Holders
| Name | % Weight |
|---|---|
| Portfolio A | 5.00% |
| Portfolio B | 3.50% |
| Portfolio C | 2.25% |
Excel Add-In Codes
| Name: =YCI("M:VGELX", "name") |
| Broad Asset Class: =YCI("M:VGELX", "broad_asset_class") |
| Broad Category: =YCI("M:VGELX", "broad_category_group") |
| Prospectus Objective: =YCI("M:VGELX", "prospectus_objective") |
| To find the codes for any of our securities and financial metrics, see our Complete Excel Reference. |