

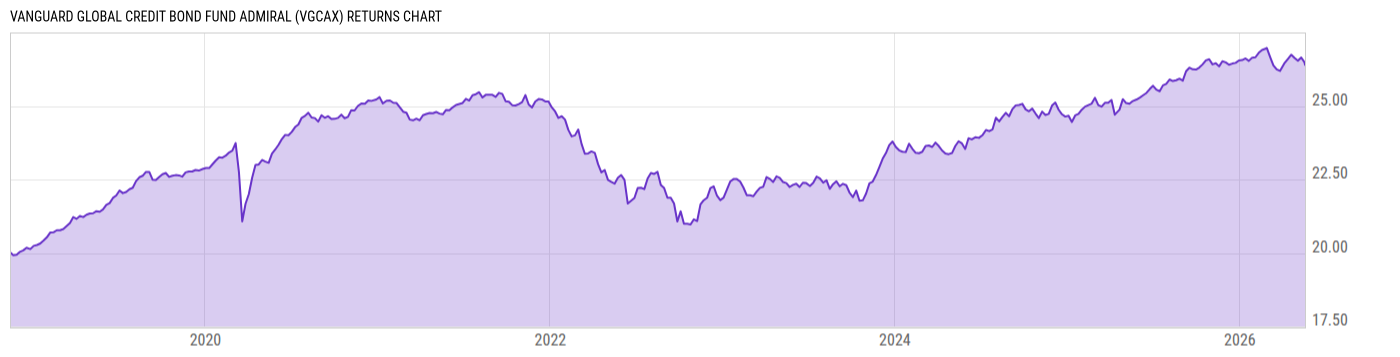
Vanguard Global Credit Bond Fund Admiral (VGCAX)
19.25
+0.04
(+0.21%)
USD |
Jun 09 2026
Returns Chart
Key Stats
| Net Expense Ratio | Total Assets Under Management | Weighted Average Dividend Yield | Turnover Ratio (Generic) |
|---|---|---|---|
| 0.25% | 994.78M | -- | 170.0% |
| 1 Year Fund Level Flows | 1 Year Total Returns (Daily) | Annualized Total Returns Since Inception (Daily) | Max Drawdown (Since Inception) |
| 189.93M | 5.50% |
Basic Info
| Investment Strategy | |
| The Fund seeks to provide a moderate and sustainable level of current income. The Fund will normally invests at least 80% of its assets in debt securities; primarily investing in investment-grade debt securities that the advisor believes will generate a moderate and sustainable level of current income. |
| General | |
| Security Type | Mutual Fund |
| Equity Style | -- |
| Broad Asset Class | Taxable Bond |
| Broad Category | Fixed Income |
| Global Peer Group | Bond Global USD |
| Peer Group | Global Income Funds |
| Global Macro | Bond Global |
| US Macro | World Income Funds |
| YCharts Categorization | -- |
| YCharts Benchmark | -- |
| Prospectus Objective | Global Income Funds |
| Fund Owner Firm Name | Vanguard |
| Broad Asset Class Benchmark Index | |
| ^BBUSATR | 100.0% |
Net Fund Flows Versus Peer Group
1 Month
% Rank:
27
-35.14M
Peer Group Low
294.12M
Peer Group High
1 Year
% Rank:
18
189.93M
-1.119B
Peer Group Low
1.537B
Peer Group High
3 Months
% Rank:
21
-325.40M
Peer Group Low
571.67M
Peer Group High
3 Years
% Rank:
11
-2.484B
Peer Group Low
2.741B
Peer Group High
6 Months
% Rank:
20
-731.75M
Peer Group Low
783.93M
Peer Group High
5 Years
% Rank:
9
-7.808B
Peer Group Low
3.313B
Peer Group High
YTD
% Rank:
27
-469.47M
Peer Group Low
717.27M
Peer Group High
10 Years
% Rank:
17
-47.03B
Peer Group Low
4.548B
Peer Group High
Date Unavailable
Risk
Performance Versus Peer Group
Annual Total Returns Versus Peers
As of June 10, 2026.
Asset Allocation
As of April 30, 2026.
| Type | % Net |
|---|---|
| Cash | -0.20% |
| Stock | 0.00% |
| Bond | 99.64% |
| Convertible | 0.00% |
| Preferred | 0.00% |
| Other | 0.56% |
Top 10 Holdings
| Name | % Weight | Price | % Change |
|---|---|---|---|
|
European Union 2.5% 14-OCT-2030
|
1.75% | -- | -- |
|
DVI Deutsche Vermoegensund Immobilienverwaltungs GmbH 4.875% 21-AUG-2030
|
1.07% | -- | -- |
| United States of America USGB 2.75 05/31/2029 FIX USD Government | 0.99% | 96.02 | 0.10% |
|
Triodos Bank NV 4.875% 12-SEP-2029
|
0.89% | -- | -- |
|
Volksbank Wien AG 5.75% 21-JUN-2034
|
0.84% | -- | -- |
|
Lithuania, Republic of (Government) 3.625% 10-MAR-2036
|
0.82% | -- | -- |
|
Indonesia, Republic of (Government) 3.75% 16-OCT-2033
|
0.74% | -- | -- |
|
Kommunalkredit Austria AG 5.25% 28-MAR-2029
|
0.69% | -- | -- |
|
Public Property Invest ASA 4.625% 12-MAR-2030
|
0.69% | -- | -- |
| Kingdom of Saudi Arabia SAUDI 5.875 01/12/2056 FIX USD Sovereign 144A | 0.65% | 95.85 | 0.31% |
Fees & Availability
| Fees | |
| Actual 12B-1 Fee | -- |
| Actual Management Fee | 0.22% |
| Administration Fee | 1.15M% |
| Maximum Front Load | -- |
| Maximum Deferred Load | -- |
| Maximum Redemption Fee | -- |
| General Availability | |
| Available for Insurance Product | No |
| Available for RRSP | No |
| Purchase Details | |
| Open to New Investors |
|
| Minimum Initial Investment | 50000.00 None |
| Minimum Subsequent Investment | 1.00 None |
Basic Info
| Investment Strategy | |
| The Fund seeks to provide a moderate and sustainable level of current income. The Fund will normally invests at least 80% of its assets in debt securities; primarily investing in investment-grade debt securities that the advisor believes will generate a moderate and sustainable level of current income. |
| General | |
| Security Type | Mutual Fund |
| Equity Style | -- |
| Broad Asset Class | Taxable Bond |
| Broad Category | Fixed Income |
| Global Peer Group | Bond Global USD |
| Peer Group | Global Income Funds |
| Global Macro | Bond Global |
| US Macro | World Income Funds |
| YCharts Categorization | -- |
| YCharts Benchmark | -- |
| Prospectus Objective | Global Income Funds |
| Fund Owner Firm Name | Vanguard |
| Broad Asset Class Benchmark Index | |
| ^BBUSATR | 100.0% |
Fundamentals
| General | |
| Distribution Yield | -- |
| Dividend Yield TTM (6-8-26) | 4.97% |
| 30-Day SEC Yield (5-31-26) | 4.71% |
| 7-Day SEC Yield | -- |
| Number of Holdings | 1702 |
| Bond | |
| Yield to Maturity (4-30-26) | 4.93% |
| Effective Duration | 5.80 |
| Average Coupon | 4.68% |
| Calculated Average Quality | 3.468 |
| Effective Maturity | 9.355 |
| Nominal Maturity | 9.801 |
| Number of Bond Holdings | 1628 |
As of April 30, 2026
Fund Details
| Key Dates | |
| Inception Date | 11/15/2018 |
| Last Annual Report Date | 10/31/2025 |
| Last Prospectus Date | 2/27/2026 |
| Share Classes | |
| VGCIX | Inv |
| Attributes | |
| Index Fund | -- |
| Inverse Fund | No |
| Leveraged Fund | -- |
| Fund of Funds | No |
| Currency Hedged Fund | -- |
| Socially Responsible Fund | No |
Top Portfolio Holders
| Name | % Weight |
|---|---|
| Portfolio A | 5.00% |
| Portfolio B | 3.50% |
| Portfolio C | 2.25% |
Excel Add-In Codes
| Name: =YCI("M:VGCAX", "name") |
| Broad Asset Class: =YCI("M:VGCAX", "broad_asset_class") |
| Broad Category: =YCI("M:VGCAX", "broad_category_group") |
| Prospectus Objective: =YCI("M:VGCAX", "prospectus_objective") |
| To find the codes for any of our securities and financial metrics, see our Complete Excel Reference. |