

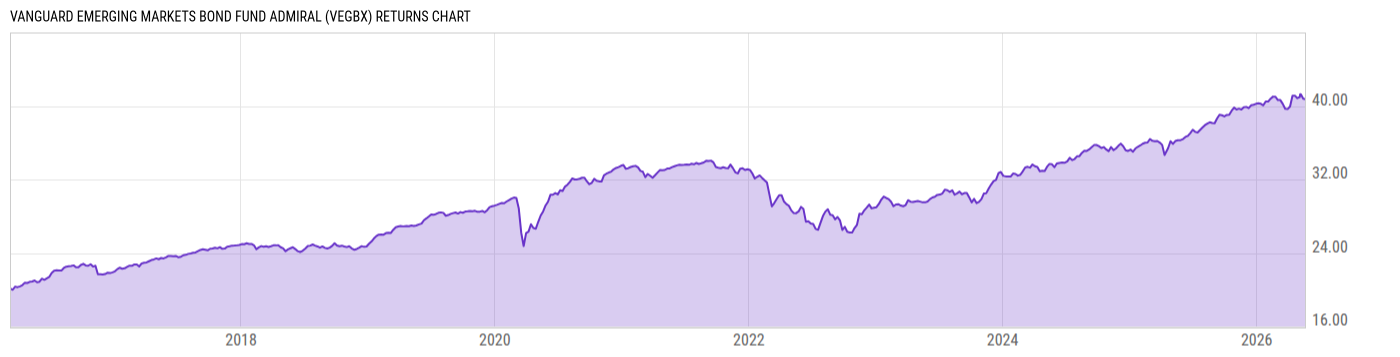
Vanguard Emerging Markets Bond Fund Admiral (VEGBX)
24.85
+0.05
(+0.20%)
USD |
Jun 09 2026
Returns Chart
Key Stats
| Net Expense Ratio | Total Assets Under Management | Weighted Average Dividend Yield | Turnover Ratio (Generic) |
|---|---|---|---|
| 0.35% | 5.762B | -- | 119.0% |
| 1 Year Fund Level Flows | 1 Year Total Returns (Daily) | Annualized Total Returns Since Inception (Daily) | Max Drawdown (Since Inception) |
| 539.46M | 12.78% |
Basic Info
| Investment Strategy | |
| The Fund seeks to provide total return while generating a moderate level of current income. The Fund invests in fixed income securities of various maturities, yields, and qualities. The Fund will invest at least 80% of assets in fixed income securities of issuers that are tied economically to emerging market countries. |
| General | |
| Security Type | Mutual Fund |
| Equity Style | -- |
| Broad Asset Class | Taxable Bond |
| Broad Category | Fixed Income |
| Global Peer Group | Bond Emerging Markets Global HC |
| Peer Group | Emerging Mrkts Hard Currency Debt Funds |
| Global Macro | Bond Emerging Markets |
| US Macro | Emerging Markets Debt Funds |
| YCharts Categorization | -- |
| YCharts Benchmark | -- |
| Prospectus Objective | Emerging Mrkts Hard Currency Debt Funds |
| Fund Owner Firm Name | Vanguard |
| Broad Asset Class Benchmark Index | |
| ^BBUSATR | 100.0% |
Net Fund Flows Versus Peer Group
1 Month
% Rank:
14
-479.78M
Peer Group Low
234.70M
Peer Group High
1 Year
% Rank:
21
539.46M
-1.381B
Peer Group Low
3.137B
Peer Group High
3 Months
% Rank:
19
-2.227B
Peer Group Low
2.507B
Peer Group High
3 Years
% Rank:
11
-4.106B
Peer Group Low
4.991B
Peer Group High
6 Months
% Rank:
21
-1.796B
Peer Group Low
2.871B
Peer Group High
5 Years
% Rank:
11
-6.046B
Peer Group Low
4.725B
Peer Group High
YTD
% Rank:
19
-2.725B
Peer Group Low
2.885B
Peer Group High
10 Years
% Rank:
11
-6.580B
Peer Group Low
6.009B
Peer Group High
Date Unavailable
Risk
Performance Versus Peer Group
Annual Total Returns Versus Peers
As of June 10, 2026.
Asset Allocation
As of March 31, 2026.
| Type | % Net |
|---|---|
| Cash | 0.64% |
| Stock | 0.00% |
| Bond | 95.34% |
| Convertible | 0.00% |
| Preferred | 0.00% |
| Other | 4.03% |
Top 10 Holdings
| Name | % Weight | Price | % Change |
|---|---|---|---|
|
Vanguard Market Liquidity Fund
|
4.03% | -- | -- |
| United States of America USGB 1.375 11/15/2031 FIX USD Government | 3.51% | 85.95 | 0.20% |
| Petroleos Mexicanos PEMEX 8.75 06/02/2029 FIX USD Corporate | 2.57% | 107.35 | -0.03% |
| Kingdom of Saudi Arabia SAUDI 5.875 01/12/2056 FIX USD Sovereign 144A | 2.57% | 95.85 | 0.31% |
|
Indonesia, Republic of (Government) 3.75% 16-OCT-2033
|
1.99% | -- | -- |
| Argentine Republic ARGENT 0.75 07/09/2030 VAR USD Sovereign | 1.97% | 87.38 | 0.09% |
| United Mexican States MEX 5.85 07/02/2032 FIX USD Sovereign | 1.58% | 100.89 | 0.07% |
|
Oman, Sultanate of (Government) 4.75% 15-JUN-2026
|
1.56% | -- | -- |
| Republic of Panama PANAMA 2.252 09/29/2032 FIX USD Sovereign | 1.47% | 83.84 | 0.04% |
| Federative Republic of Brazil BRAZIL 7.25 01/12/2056 FIX USD Sovereign | 1.36% | 99.76 | -0.20% |
Fees & Availability
| Fees | |
| Actual 12B-1 Fee | -- |
| Actual Management Fee | 0.33% |
| Administration Fee | 12.01M% |
| Maximum Front Load | -- |
| Maximum Deferred Load | -- |
| Maximum Redemption Fee | -- |
| General Availability | |
| Available for Insurance Product | No |
| Available for RRSP | No |
| Purchase Details | |
| Open to New Investors |
|
| Minimum Initial Investment | 50000.00 None |
| Minimum Subsequent Investment | 1.00 None |
Basic Info
| Investment Strategy | |
| The Fund seeks to provide total return while generating a moderate level of current income. The Fund invests in fixed income securities of various maturities, yields, and qualities. The Fund will invest at least 80% of assets in fixed income securities of issuers that are tied economically to emerging market countries. |
| General | |
| Security Type | Mutual Fund |
| Equity Style | -- |
| Broad Asset Class | Taxable Bond |
| Broad Category | Fixed Income |
| Global Peer Group | Bond Emerging Markets Global HC |
| Peer Group | Emerging Mrkts Hard Currency Debt Funds |
| Global Macro | Bond Emerging Markets |
| US Macro | Emerging Markets Debt Funds |
| YCharts Categorization | -- |
| YCharts Benchmark | -- |
| Prospectus Objective | Emerging Mrkts Hard Currency Debt Funds |
| Fund Owner Firm Name | Vanguard |
| Broad Asset Class Benchmark Index | |
| ^BBUSATR | 100.0% |
Fundamentals
| General | |
| Distribution Yield | -- |
| Dividend Yield TTM (6-8-26) | 6.18% |
| 30-Day SEC Yield (5-31-26) | 5.61% |
| 7-Day SEC Yield | -- |
| Number of Holdings | 267 |
| Bond | |
| Yield to Maturity (3-31-26) | 6.56% |
| Effective Duration | 6.10 |
| Average Coupon | 5.46% |
| Calculated Average Quality | 4.748 |
| Effective Maturity | 9.541 |
| Nominal Maturity | 9.966 |
| Number of Bond Holdings | 244 |
As of March 31, 2026
Fund Details
| Key Dates | |
| Inception Date | 12/6/2017 |
| Last Annual Report Date | 9/30/2025 |
| Last Prospectus Date | 1/28/2026 |
| Share Classes | |
| VEMBX | Inv |
| Attributes | |
| Index Fund | -- |
| Inverse Fund | No |
| Leveraged Fund | -- |
| Fund of Funds | No |
| Currency Hedged Fund | -- |
| Socially Responsible Fund | No |
Top Portfolio Holders
| Name | % Weight |
|---|---|
| Portfolio A | 5.00% |
| Portfolio B | 3.50% |
| Portfolio C | 2.25% |
Excel Add-In Codes
| Name: =YCI("M:VEGBX", "name") |
| Broad Asset Class: =YCI("M:VEGBX", "broad_asset_class") |
| Broad Category: =YCI("M:VEGBX", "broad_category_group") |
| Prospectus Objective: =YCI("M:VEGBX", "prospectus_objective") |
| To find the codes for any of our securities and financial metrics, see our Complete Excel Reference. |