

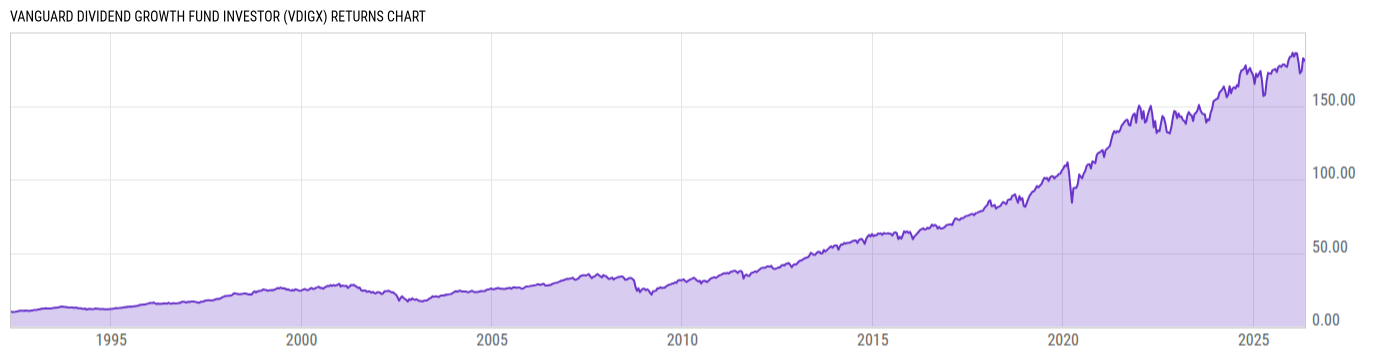
Vanguard Dividend Growth Fund Investor (VDIGX)
31.21
+0.27
(+0.87%)
USD |
Jun 09 2026
Returns Chart
Key Stats
| Net Expense Ratio | Total Assets Under Management | Weighted Average Dividend Yield | Turnover Ratio (Generic) |
|---|---|---|---|
| 0.20% | 36.39B | 1.58% | 40.00% |
| 1 Year Fund Level Flows | 1 Year Total Returns (Daily) | Annualized Total Returns Since Inception (Daily) | Max Drawdown (Since Inception) |
| -13.74B | 7.60% |
Basic Info
| Investment Strategy | |
| The Fund seeks to provide, primarily, a growing stream of income over time. It invests primarily in stocks that offer current dividends. It focuses on high-quality companies that have prospects for long-term total returns as a result of their ability to grow earnings and willingness to increase dividends over time. |
| General | |
| Security Type | Mutual Fund |
| Equity Style | Large Cap Core |
| Broad Asset Class | US Equity |
| Broad Category | Equity |
| Global Peer Group | Equity US Income |
| Peer Group | Equity Income Funds |
| Global Macro | Equity North America |
| US Macro | Equity Income Funds |
| YCharts Categorization | -- |
| YCharts Benchmark | -- |
| Prospectus Objective | Equity Income Funds |
| Fund Owner Firm Name | Vanguard |
| Broad Asset Class Benchmark Index | |
| ^SPXTR | 100.0% |
Net Fund Flows Versus Peer Group
1 Month
% Rank:
100
-1.343B
Peer Group Low
2.598B
Peer Group High
1 Year
% Rank:
100
-13.74B
-13.74B
Peer Group Low
11.56B
Peer Group High
3 Months
% Rank:
100
-3.430B
Peer Group Low
6.150B
Peer Group High
3 Years
% Rank:
100
-26.78B
Peer Group Low
23.13B
Peer Group High
6 Months
% Rank:
100
-7.340B
Peer Group Low
9.275B
Peer Group High
5 Years
% Rank:
100
-29.17B
Peer Group Low
42.64B
Peer Group High
YTD
% Rank:
100
-5.162B
Peer Group Low
9.031B
Peer Group High
10 Years
% Rank:
100
-32.11B
Peer Group Low
55.29B
Peer Group High
Date Unavailable
Risk
Performance Versus Peer Group
Annual Total Returns Versus Peers
As of June 10, 2026.
Asset Allocation
As of March 31, 2026.
| Type | % Net |
|---|---|
| Cash | 0.24% |
| Stock | 99.76% |
| Bond | 0.00% |
| Convertible | 0.00% |
| Preferred | 0.00% |
| Other | 0.00% |
Top 10 Holdings
| Name | % Weight | Price | % Change |
|---|---|---|---|
| Microsoft Corp. | 5.02% | 397.35 | -1.50% |
| Broadcom Inc. | 4.99% | 371.92 | -5.16% |
| Eli Lilly & Co. | 4.07% | 1136.26 | -0.74% |
| Mastercard, Inc. | 3.57% | 488.92 | -1.28% |
| Apple, Inc. | 3.42% | 291.63 | 0.37% |
| Northrop Grumman Corp. | 3.13% | 542.32 | -1.16% |
| Visa, Inc. | 3.11% | 322.84 | -0.68% |
| Texas Instruments Incorporated | 2.94% | 282.07 | -2.27% |
| Wells Fargo & Co. | 2.82% | 81.94 | -0.07% |
| Honeywell International, Inc. | 2.74% | 205.78 | -4.60% |
Fees & Availability
| Fees | |
| Actual 12B-1 Fee | -- |
| Actual Management Fee | 0.21% |
| Administration Fee | 61.26M% |
| Maximum Front Load | -- |
| Maximum Deferred Load | -- |
| Maximum Redemption Fee | -- |
| General Availability | |
| Available for Insurance Product | No |
| Available for RRSP | No |
| Purchase Details | |
| Open to New Investors |
|
| Minimum Initial Investment | 0.00 None |
| Minimum Subsequent Investment | 0.00 None |
Basic Info
| Investment Strategy | |
| The Fund seeks to provide, primarily, a growing stream of income over time. It invests primarily in stocks that offer current dividends. It focuses on high-quality companies that have prospects for long-term total returns as a result of their ability to grow earnings and willingness to increase dividends over time. |
| General | |
| Security Type | Mutual Fund |
| Equity Style | Large Cap Core |
| Broad Asset Class | US Equity |
| Broad Category | Equity |
| Global Peer Group | Equity US Income |
| Peer Group | Equity Income Funds |
| Global Macro | Equity North America |
| US Macro | Equity Income Funds |
| YCharts Categorization | -- |
| YCharts Benchmark | -- |
| Prospectus Objective | Equity Income Funds |
| Fund Owner Firm Name | Vanguard |
| Broad Asset Class Benchmark Index | |
| ^SPXTR | 100.0% |
Fundamentals
| General | |
| Distribution Yield | -- |
| Dividend Yield TTM (6-8-26) | 1.82% |
| 30-Day SEC Yield (5-31-26) | 1.29% |
| 7-Day SEC Yield | -- |
| Number of Holdings | 66 |
| Stock | |
| Weighted Average PE Ratio | 29.84 |
| Weighted Average Price to Sales Ratio | 7.121 |
| Weighted Average Price to Book Ratio | 11.00 |
| Weighted Median ROE | 52.29% |
| Weighted Median ROA | 13.15% |
| ROI (TTM) | 20.39% |
| Return on Investment (TTM) | 20.39% |
| Earning Yield | 0.0381 |
| LT Debt / Shareholders Equity | 1.047 |
| Number of Equity Holdings | 50 |
As of March 31, 2026
Growth Metrics
| EPS Growth (1Y) | 15.06% |
| EPS Growth (3Y) | 10.08% |
| EPS Growth (5Y) | 20.07% |
| Sales Growth (1Y) | 10.22% |
| Sales Growth (3Y) | 8.01% |
| Sales Growth (5Y) | 10.32% |
| Sales per Share Growth (1Y) | 11.64% |
| Sales per Share Growth (3Y) | 9.37% |
| Operating Cash Flow - Growth Rate (3Y) | 9.63% |
As of March 31, 2026
Fund Details
| Key Dates | |
| Inception Date | 5/15/1992 |
| Last Annual Report Date | 1/31/2026 |
| Last Prospectus Date | 5/29/2025 |
| Attributes | |
| Index Fund | -- |
| Inverse Fund | No |
| Leveraged Fund | -- |
| Fund of Funds | No |
| Currency Hedged Fund | -- |
| Socially Responsible Fund | No |
Top Portfolio Holders
| Name | % Weight |
|---|---|
| Portfolio A | 5.00% |
| Portfolio B | 3.50% |
| Portfolio C | 2.25% |
Excel Add-In Codes
| Name: =YCI("M:VDIGX", "name") |
| Broad Asset Class: =YCI("M:VDIGX", "broad_asset_class") |
| Broad Category: =YCI("M:VDIGX", "broad_category_group") |
| Prospectus Objective: =YCI("M:VDIGX", "prospectus_objective") |
| To find the codes for any of our securities and financial metrics, see our Complete Excel Reference. |