

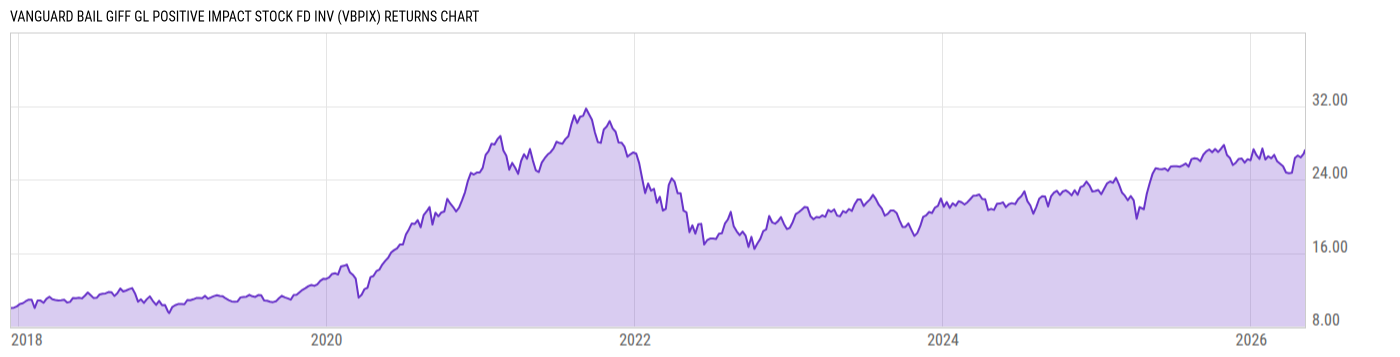
Vanguard Bail Giff Gl Positive Impact Stock Fd Inv (VBPIX)
23.24
-0.02
(-0.09%)
USD |
May 08 2026
Returns Chart
Key Stats
| Net Expense Ratio | Total Assets Under Management | Weighted Average Dividend Yield | Turnover Ratio (Generic) |
|---|---|---|---|
| 0.59% | 249.91M | 0.79% | 32.00% |
| 1 Year Fund Level Flows | 1 Year Total Returns (Daily) | Annualized Total Returns Since Inception (Daily) | Max Drawdown (Since Inception) |
| 24.61M | 13.71% |
Basic Info
| Investment Strategy | |
| The Fund seeks capital appreciation with an emphasis on investing in businesses that deliver positive change by contributing towards a more sustainable and inclusive world. The Fund invests at least 80% of its assets predominantly in equity securities issued by companies located in countries contained in MSCI ACWI Index. |
| General | |
| Security Type | Mutual Fund |
| Equity Style | Multi Cap Growth |
| Broad Asset Class | International Equity |
| Broad Category | Equity |
| Global Peer Group | Equity Global |
| Peer Group | Global Multi-Cap Growth |
| Global Macro | Equity Global |
| US Macro | Developed Global Markets Funds |
| YCharts Categorization | -- |
| YCharts Benchmark | -- |
| Prospectus Objective | Global Funds |
| Fund Owner Firm Name | Vanguard |
| Broad Asset Class Benchmark Index | |
| ^MSACXUSNTR | 100.0% |
Net Fund Flows Versus Peer Group
1 Month
% Rank:
70
-1.084B
Peer Group Low
277.64M
Peer Group High
1 Year
% Rank:
32
24.61M
-3.785B
Peer Group Low
1.206B
Peer Group High
3 Months
% Rank:
63
-1.124B
Peer Group Low
739.43M
Peer Group High
3 Years
% Rank:
36
-6.739B
Peer Group Low
1.741B
Peer Group High
6 Months
% Rank:
59
-1.977B
Peer Group Low
849.51M
Peer Group High
5 Years
% Rank:
26
-7.536B
Peer Group Low
3.109B
Peer Group High
YTD
% Rank:
63
-1.251B
Peer Group Low
800.60M
Peer Group High
10 Years
% Rank:
28
-7.837B
Peer Group Low
7.268B
Peer Group High
Date Unavailable
Risk
Performance Versus Peer Group
Annual Total Returns Versus Peers
As of May 10, 2026.
Asset Allocation
As of March 31, 2026.
| Type | % Net |
|---|---|
| Cash | -0.63% |
| Stock | 100.5% |
| Bond | 0.00% |
| Convertible | 0.00% |
| Preferred | 0.00% |
| Other | 0.18% |
Top 10 Holdings
| Name | % Weight | Price | % Change |
|---|---|---|---|
| Taiwan Semiconductor Manufacturing Co., Ltd. | 9.46% | 17.24 | 0.00% |
| ASML Holding NV | 6.84% | 1591.09 | 6.44% |
| Deere & Co. | 5.50% | 574.84 | -0.98% |
| Microsoft Corp. | 4.14% | 415.12 | -1.34% |
| The New York Times Co. | 4.02% | 79.41 | -0.96% |
| Sandoz Group AG | 3.83% | 78.54 | 0.00% |
| Ecolab, Inc. | 3.60% | 254.22 | -0.91% |
| Remitly Global, Inc. | 3.57% | 24.03 | 5.44% |
| Alnylam Pharmaceuticals, Inc. | 3.47% | 295.05 | -0.29% |
| MercadoLibre, Inc. | 3.13% | 1632.52 | -12.70% |
Fees & Availability
| Fees | |
| Actual 12B-1 Fee | -- |
| Actual Management Fee | 0.55% |
| Administration Fee | 224.0K% |
| Maximum Front Load | -- |
| Maximum Deferred Load | -- |
| Maximum Redemption Fee | -- |
| General Availability | |
| Available for Insurance Product | No |
| Available for RRSP | No |
| Purchase Details | |
| Open to New Investors |
|
| Minimum Initial Investment | 3000.00 None |
| Minimum Subsequent Investment | 1.00 None |
Basic Info
| Investment Strategy | |
| The Fund seeks capital appreciation with an emphasis on investing in businesses that deliver positive change by contributing towards a more sustainable and inclusive world. The Fund invests at least 80% of its assets predominantly in equity securities issued by companies located in countries contained in MSCI ACWI Index. |
| General | |
| Security Type | Mutual Fund |
| Equity Style | Multi Cap Growth |
| Broad Asset Class | International Equity |
| Broad Category | Equity |
| Global Peer Group | Equity Global |
| Peer Group | Global Multi-Cap Growth |
| Global Macro | Equity Global |
| US Macro | Developed Global Markets Funds |
| YCharts Categorization | -- |
| YCharts Benchmark | -- |
| Prospectus Objective | Global Funds |
| Fund Owner Firm Name | Vanguard |
| Broad Asset Class Benchmark Index | |
| ^MSACXUSNTR | 100.0% |
Fundamentals
| General | |
| Distribution Yield | -- |
| Dividend Yield TTM (5-7-26) | 0.14% |
| 30-Day SEC Yield (3-31-26) | 0.12% |
| 7-Day SEC Yield | -- |
| Number of Holdings | 41 |
| Stock | |
| Weighted Average PE Ratio | 34.45 |
| Weighted Average Price to Sales Ratio | 6.920 |
| Weighted Average Price to Book Ratio | 7.769 |
| Weighted Median ROE | 23.79% |
| Weighted Median ROA | 9.54% |
| ROI (TTM) | 15.95% |
| Return on Investment (TTM) | 15.95% |
| Earning Yield | 0.0359 |
| LT Debt / Shareholders Equity | 0.6161 |
| Number of Equity Holdings | 38 |
As of March 31, 2026
Growth Metrics
| EPS Growth (1Y) | 30.46% |
| EPS Growth (3Y) | 16.82% |
| EPS Growth (5Y) | 20.88% |
| Sales Growth (1Y) | 17.85% |
| Sales Growth (3Y) | 16.91% |
| Sales Growth (5Y) | 22.06% |
| Sales per Share Growth (1Y) | 309.2% |
| Sales per Share Growth (3Y) | 15.49% |
| Operating Cash Flow - Growth Rate (3Y) | 26.64% |
As of March 31, 2026
Fund Details
| Key Dates | |
| Inception Date | 12/14/2017 |
| Last Annual Report Date | 12/31/2025 |
| Last Prospectus Date | 4/29/2025 |
| Attributes | |
| Index Fund | -- |
| Inverse Fund | No |
| Leveraged Fund | -- |
| Fund of Funds | No |
| Currency Hedged Fund | -- |
| Socially Responsible Fund |
|
Top Portfolio Holders
| Name | % Weight |
|---|---|
| Portfolio A | 5.00% |
| Portfolio B | 3.50% |
| Portfolio C | 2.25% |
Excel Add-In Codes
| Name: =YCI("M:VBPIX", "name") |
| Broad Asset Class: =YCI("M:VBPIX", "broad_asset_class") |
| Broad Category: =YCI("M:VBPIX", "broad_category_group") |
| Prospectus Objective: =YCI("M:VBPIX", "prospectus_objective") |
| To find the codes for any of our securities and financial metrics, see our Complete Excel Reference. |