

Vanguard Long-Term Bond Index Fund Institutional + (VBLIX)
10.28
-0.04
(-0.39%)
USD |
Jun 08 2026
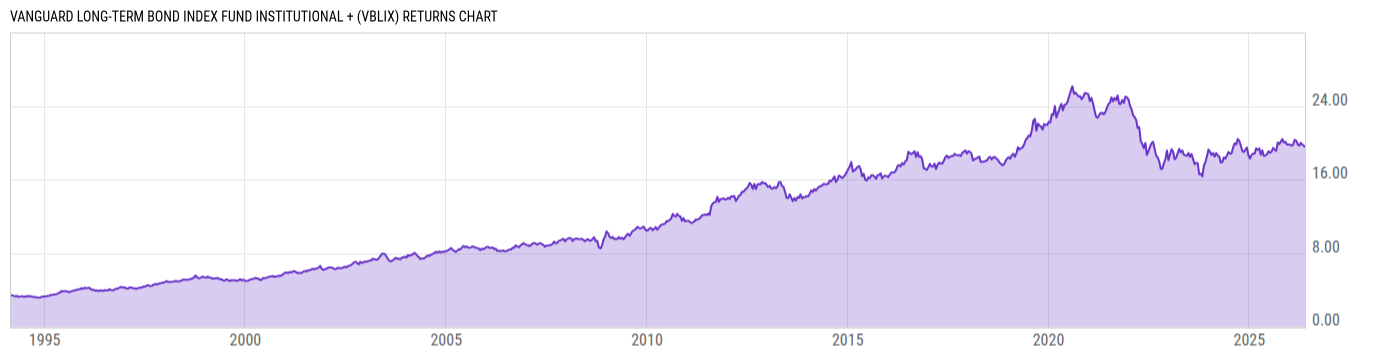
Returns Chart
Key Stats
| Net Expense Ratio | Total Assets Under Management | Weighted Average Dividend Yield | Turnover Ratio (Generic) |
|---|---|---|---|
| 0.02% | 8.548B | -- | 24.00% |
| 1 Year Fund Level Flows | 1 Year Total Returns (Daily) | Annualized Total Returns Since Inception (Daily) | Max Drawdown (Since Inception) |
| -414.27M | 5.52% |
Basic Info
| Investment Strategy | |
| The Fund seeks to track the performance of a market-weighted bond index with a long-term dollar-weighted average maturity. The Fund employs an indexing investment approach to track the performance of the Bloomberg Barclays U.S. Long Government/Credit Float Adjusted Index and invests by sampling the index. |
| General | |
| Security Type | Mutual Fund |
| Equity Style | -- |
| Broad Asset Class | Taxable Bond |
| Broad Category | Fixed Income |
| Global Peer Group | Bond USD Corporates |
| Peer Group | Corporate Debt Funds A Rated |
| Global Macro | Bond Corporates |
| US Macro | General Domestic Taxable Fixed Income Funds |
| YCharts Categorization | -- |
| YCharts Benchmark | -- |
| Prospectus Objective | Corporate Debt Funds A Rated |
| Fund Owner Firm Name | Vanguard |
| Broad Asset Class Benchmark Index | |
| ^BBUSATR | 100.0% |
Net Fund Flows Versus Peer Group
1 Month
% Rank:
17
-93.62M
Peer Group Low
18.95M
Peer Group High
1 Year
% Rank:
75
-414.27M
-1.604B
Peer Group Low
129.59M
Peer Group High
3 Months
% Rank:
14
-282.87M
Peer Group Low
109.60M
Peer Group High
3 Years
% Rank:
14
-6.775B
Peer Group Low
475.50M
Peer Group High
6 Months
% Rank:
8
-575.70M
Peer Group Low
190.14M
Peer Group High
5 Years
% Rank:
8
-7.297B
Peer Group Low
673.98M
Peer Group High
YTD
% Rank:
8
-445.53M
Peer Group Low
84.78M
Peer Group High
10 Years
% Rank:
70
-6.319B
Peer Group Low
1.288B
Peer Group High
Date Unavailable
Risk
Performance Versus Peer Group
Annual Total Returns Versus Peers
As of June 09, 2026.
Asset Allocation
As of April 30, 2026.
| Type | % Net |
|---|---|
| Cash | -0.08% |
| Stock | 0.00% |
| Bond | 99.91% |
| Convertible | 0.00% |
| Preferred | 0.00% |
| Other | 0.17% |
Top 10 Holdings
| Name | % Weight | Price | % Change |
|---|---|---|---|
| United States of America USGB 4.75 02/15/2056 FIX USD Government | 1.40% | 95.47 | -0.50% |
| United States of America USGB 4.75 08/15/2055 FIX USD Government | 1.21% | 95.40 | -0.52% |
| United States of America USGB 4.5 11/15/2054 FIX USD Government | 1.18% | 91.50 | -0.53% |
| United States of America USGB 4.75 11/15/2053 FIX USD Government | 1.18% | 95.18 | -0.52% |
| United States of America USGB 4.625 02/15/2055 FIX USD Government | 1.15% | 93.43 | -0.55% |
| United States of America USGB 4.25 02/15/2054 FIX USD Government | 1.14% | 87.72 | -0.53% |
| United States of America USGB 4.625 05/15/2054 FIX USD Government | 1.12% | 93.40 | -0.53% |
| United States of America USGB 4.25 08/15/2054 FIX USD Government | 1.12% | 87.75 | -0.55% |
| United States of America USGB 4.625 11/15/2055 FIX USD Government | 1.08% | 93.50 | -0.54% |
| United States of America USGB 4.125 08/15/2053 FIX USD Government | 0.99% | 85.89 | -0.53% |
Fees & Availability
| Fees | |
| Actual 12B-1 Fee | -- |
| Actual Management Fee | 0.02% |
| Administration Fee | 43.00K% |
| Maximum Front Load | -- |
| Maximum Deferred Load | -- |
| Maximum Redemption Fee | -- |
| General Availability | |
| Available for Insurance Product | No |
| Available for RRSP | No |
| Purchase Details | |
| Open to New Investors |
|
| Minimum Initial Investment | 100.00M None |
| Minimum Subsequent Investment | 1.00 None |
Basic Info
| Investment Strategy | |
| The Fund seeks to track the performance of a market-weighted bond index with a long-term dollar-weighted average maturity. The Fund employs an indexing investment approach to track the performance of the Bloomberg Barclays U.S. Long Government/Credit Float Adjusted Index and invests by sampling the index. |
| General | |
| Security Type | Mutual Fund |
| Equity Style | -- |
| Broad Asset Class | Taxable Bond |
| Broad Category | Fixed Income |
| Global Peer Group | Bond USD Corporates |
| Peer Group | Corporate Debt Funds A Rated |
| Global Macro | Bond Corporates |
| US Macro | General Domestic Taxable Fixed Income Funds |
| YCharts Categorization | -- |
| YCharts Benchmark | -- |
| Prospectus Objective | Corporate Debt Funds A Rated |
| Fund Owner Firm Name | Vanguard |
| Broad Asset Class Benchmark Index | |
| ^BBUSATR | 100.0% |
Fundamentals
| General | |
| Distribution Yield | -- |
| Dividend Yield TTM (6-5-26) | 4.84% |
| 30-Day SEC Yield (5-31-26) | 5.41% |
| 7-Day SEC Yield | -- |
| Number of Holdings | 2974 |
| Bond | |
| Yield to Maturity (4-30-26) | 5.37% |
| Effective Duration | 12.90 |
| Average Coupon | 4.11% |
| Calculated Average Quality | 2.570 |
| Effective Maturity | 21.97 |
| Nominal Maturity | 22.11 |
| Number of Bond Holdings | 2954 |
As of April 30, 2026
Fund Details
Top Portfolio Holders
| Name | % Weight |
|---|---|
| Portfolio A | 5.00% |
| Portfolio B | 3.50% |
| Portfolio C | 2.25% |
Excel Add-In Codes
| Name: =YCI("M:VBLIX", "name") |
| Broad Asset Class: =YCI("M:VBLIX", "broad_asset_class") |
| Broad Category: =YCI("M:VBLIX", "broad_category_group") |
| Prospectus Objective: =YCI("M:VBLIX", "prospectus_objective") |
| To find the codes for any of our securities and financial metrics, see our Complete Excel Reference. |