

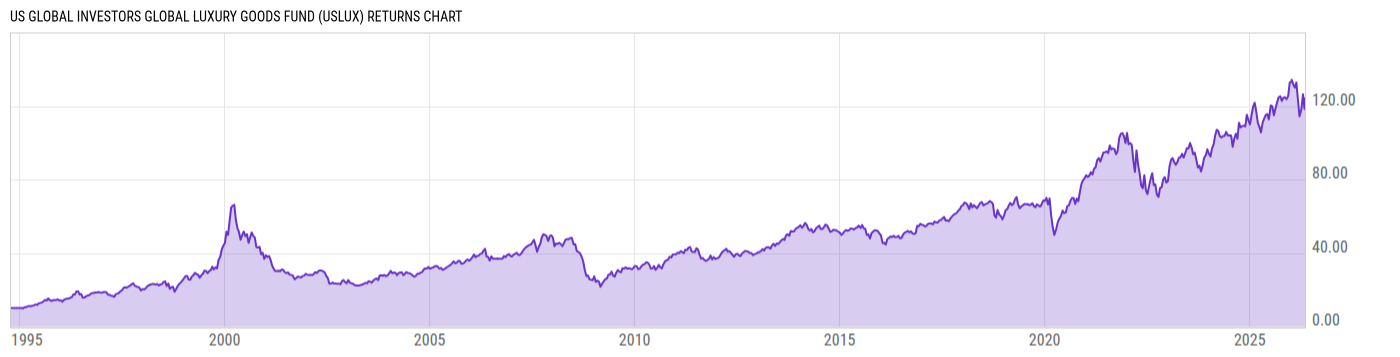
US Global Investors Global Luxury Goods Fund (USLUX)
20.30
-0.41
(-1.98%)
USD |
Jun 10 2026
Returns Chart
Key Stats
| Net Expense Ratio | Total Assets Under Management | Weighted Average Dividend Yield | Turnover Ratio (Generic) |
|---|---|---|---|
| 1.73% | 50.00M | 1.61% | 122.0% |
| 1 Year Fund Level Flows | 1 Year Total Returns (Daily) | Annualized Total Returns Since Inception (Daily) | Max Drawdown (Since Inception) |
| -2.734M | 4.32% |
Basic Info
| Investment Strategy | |
| The Fund seeks long term growth of capital by investing primarily in a diversified portfolio of common stocks of companies with superior growth, profitability, and quality relative to companies in the same industry. The Fund may invest a significant amount of its total assets in technology companies. |
| General | |
| Security Type | Mutual Fund |
| Equity Style | Multi Cap Growth |
| Broad Asset Class | Sector Equity |
| Broad Category | Equity |
| Global Peer Group | Equity Sector Consumer Discretionary |
| Peer Group | Consumer Services Funds |
| Global Macro | Equity Industry Sector |
| US Macro | Sector Equity Funds |
| YCharts Categorization | -- |
| YCharts Benchmark | -- |
| Prospectus Objective | Consumer Services Funds |
| Fund Owner Firm Name | US Global Investors |
| Broad Asset Class Benchmark Index | |
| ^MSWNTR | 100.0% |
Net Fund Flows Versus Peer Group
1 Month
% Rank:
49
-48.97M
Peer Group Low
420.36M
Peer Group High
1 Year
% Rank:
44
-2.734M
-645.52M
Peer Group Low
392.23M
Peer Group High
3 Months
% Rank:
39
-180.66M
Peer Group Low
182.47M
Peer Group High
3 Years
% Rank:
59
-1.572B
Peer Group Low
474.15M
Peer Group High
6 Months
% Rank:
25
-368.14M
Peer Group Low
200.47M
Peer Group High
5 Years
% Rank:
34
-2.821B
Peer Group Low
544.92M
Peer Group High
YTD
% Rank:
32
-949.83M
Peer Group Low
166.18M
Peer Group High
10 Years
% Rank:
65
-4.639B
Peer Group Low
464.25M
Peer Group High
Date Unavailable
Risk
Performance Versus Peer Group
Annual Total Returns Versus Peers
As of June 11, 2026.
Asset Allocation
As of March 31, 2026.
| Type | % Net |
|---|---|
| Cash | 10.90% |
| Stock | 86.91% |
| Bond | 0.00% |
| Convertible | 0.00% |
| Preferred | 0.15% |
| Other | 2.04% |
Top 10 Holdings
| Name | % Weight | Price | % Change |
|---|---|---|---|
|
Brown Brothers Harriman & Co
|
10.90% | -- | -- |
| LVMH Moët Hennessy Louis Vuitton SE | 7.07% | 112.25 | -1.50% |
| Hermes International SCA | 6.84% | 1870.87 | -3.43% |
| Ferrari NV | 5.51% | 356.96 | 3.00% |
| Tesla, Inc. | 5.42% | 386.80 | 1.37% |
| Compagnie Financière Richemont SA | 4.85% | 212.09 | -1.35% |
| Royal Caribbean Group | 4.82% | 274.43 | 2.12% |
| Amazon.com, Inc. | 4.07% | 237.45 | -0.23% |
| Mercedes-Benz Group AG | 3.64% | 13.53 | -1.55% |
|
Carnival Corp ORD
|
2.79% | -- | -- |
Fees & Availability
| Fees | |
| Actual 12B-1 Fee | 0.25% |
| Actual Management Fee | 0.80% |
| Administration Fee | 104.6K% |
| Maximum Front Load | -- |
| Maximum Deferred Load | -- |
| Maximum Redemption Fee | 0.00% |
| General Availability | |
| Available for Insurance Product | No |
| Available for RRSP | No |
| Purchase Details | |
| Open to New Investors |
|
| Minimum Initial Investment | 5000.00 None |
| Minimum Subsequent Investment | 100.00 None |
Basic Info
| Investment Strategy | |
| The Fund seeks long term growth of capital by investing primarily in a diversified portfolio of common stocks of companies with superior growth, profitability, and quality relative to companies in the same industry. The Fund may invest a significant amount of its total assets in technology companies. |
| General | |
| Security Type | Mutual Fund |
| Equity Style | Multi Cap Growth |
| Broad Asset Class | Sector Equity |
| Broad Category | Equity |
| Global Peer Group | Equity Sector Consumer Discretionary |
| Peer Group | Consumer Services Funds |
| Global Macro | Equity Industry Sector |
| US Macro | Sector Equity Funds |
| YCharts Categorization | -- |
| YCharts Benchmark | -- |
| Prospectus Objective | Consumer Services Funds |
| Fund Owner Firm Name | US Global Investors |
| Broad Asset Class Benchmark Index | |
| ^MSWNTR | 100.0% |
Fundamentals
| General | |
| Distribution Yield | -- |
| Dividend Yield TTM (6-10-26) | 0.01% |
| 30-Day SEC Yield | -- |
| 7-Day SEC Yield | -- |
| Number of Holdings | 55 |
| Stock | |
| Weighted Average PE Ratio | 28.13 |
| Weighted Average Price to Sales Ratio | 6.557 |
| Weighted Average Price to Book Ratio | 7.559 |
| Weighted Median ROE | 25.71% |
| Weighted Median ROA | 8.30% |
| ROI (TTM) | 11.49% |
| Return on Investment (TTM) | 11.49% |
| Earning Yield | 0.0514 |
| LT Debt / Shareholders Equity | 0.9513 |
| Number of Equity Holdings | 49 |
As of March 31, 2026
Growth Metrics
| EPS Growth (1Y) | 8.78% |
| EPS Growth (3Y) | 3.51% |
| EPS Growth (5Y) | 16.03% |
| Sales Growth (1Y) | 5.94% |
| Sales Growth (3Y) | 10.95% |
| Sales Growth (5Y) | 18.87% |
| Sales per Share Growth (1Y) | 7.34% |
| Sales per Share Growth (3Y) | 11.38% |
| Operating Cash Flow - Growth Rate (3Y) | 16.55% |
As of March 31, 2026
Fund Details
| Key Dates | |
| Inception Date | 10/17/1994 |
| Last Annual Report Date | 12/31/2025 |
| Last Prospectus Date | 5/1/2025 |
| Attributes | |
| Index Fund | -- |
| Inverse Fund | No |
| Leveraged Fund | -- |
| Fund of Funds | No |
| Currency Hedged Fund | -- |
| Socially Responsible Fund | No |
Top Portfolio Holders
| Name | % Weight |
|---|---|
| Portfolio A | 5.00% |
| Portfolio B | 3.50% |
| Portfolio C | 2.25% |
Excel Add-In Codes
| Name: =YCI("M:USLUX", "name") |
| Broad Asset Class: =YCI("M:USLUX", "broad_asset_class") |
| Broad Category: =YCI("M:USLUX", "broad_category_group") |
| Prospectus Objective: =YCI("M:USLUX", "prospectus_objective") |
| To find the codes for any of our securities and financial metrics, see our Complete Excel Reference. |