

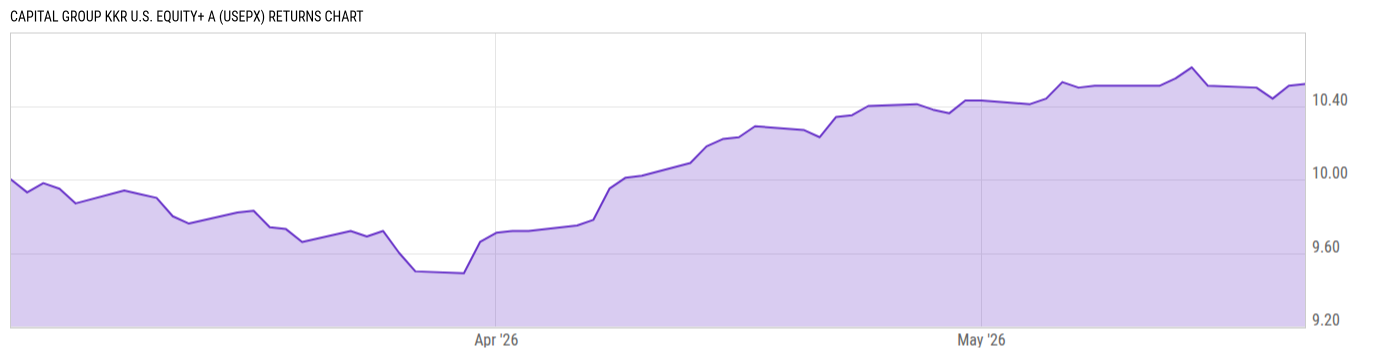
Capital Group KKR U.S. Equity+ A (USEPX)
10.51
+0.07
(+0.67%)
USD |
May 20 2026
Returns Chart
Key Stats
| Net Expense Ratio | Total Assets Under Management | Weighted Average Dividend Yield | Turnover Ratio (Generic) |
|---|---|---|---|
| 1.05% | 99.41M | -- | -- |
| 1 Year Fund Level Flows | 1 Year Total Returns (Daily) | Annualized Total Returns Since Inception (Daily) | Max Drawdown (Since Inception) |
| -- | -- |
Basic Info
| Investment Strategy | |
| The Fund seeks long-term capital appreciation by investing in both publicly traded and private equity securities that the adviser believes have the potential for appreciation. The Fund expects to invest 60% of its net assets in publicly traded equity securities and 40% of its net assets in private equity securities. |
| General | |
| Security Type | Unlisted Closed-End Fund |
| Equity Style | -- |
| Broad Asset Class | Sector Equity |
| Broad Category | Equity |
| Global Peer Group | Equity Other |
| Peer Group | Sector Equity Funds |
| Global Macro | Equity Other |
| US Macro | -- |
| YCharts Categorization | -- |
| YCharts Benchmark | -- |
| Prospectus Objective | Sector Equity Funds |
| Fund Owner Firm Name | Capital Group/American Funds |
| Broad Asset Class Benchmark Index | |
| ^MSWNTR | 100.0% |
Net Fund Flows Versus Peer Group
1 Month
% Rank:
--
184.54M
Peer Group Low
184.54M
Peer Group High
1 Year
% Rank:
--
2.188B
Peer Group Low
2.188B
Peer Group High
3 Months
% Rank:
--
459.53M
Peer Group Low
459.53M
Peer Group High
3 Years
% Rank:
--
3.666B
Peer Group Low
3.666B
Peer Group High
6 Months
% Rank:
--
1.039B
Peer Group Low
1.039B
Peer Group High
5 Years
% Rank:
--
--
Peer Group Low
--
Peer Group High
YTD
% Rank:
--
459.53M
Peer Group Low
459.53M
Peer Group High
10 Years
% Rank:
--
--
Peer Group Low
--
Peer Group High
Date Unavailable
Risk
Performance Versus Peer Group
Annual Total Returns Versus Peers
As of May 21, 2026.
Asset Allocation
| Type | % Net |
|---|
Top Holdings
| Name | % Weight | Price | % Change |
|---|---|---|---|
| -- | -- | -- | -- |
| -- | -- | -- | -- |
| -- | -- | -- | -- |
| -- | -- | -- | -- |
| -- | -- | -- | -- |
Fees & Availability
| Fees | |
| Actual 12B-1 Fee | 0.30% |
| Actual Management Fee | 0.19% |
| Administration Fee | -- |
| Maximum Front Load | 5.75% |
| Maximum Deferred Load | -- |
| Maximum Redemption Fee | -- |
| General Availability | |
| Available for Insurance Product | No |
| Available for RRSP | No |
| Purchase Details | |
| Open to New Investors |
|
| Minimum Initial Investment | 1000.00 None |
| Minimum Subsequent Investment | 50.00 None |
Basic Info
| Investment Strategy | |
| The Fund seeks long-term capital appreciation by investing in both publicly traded and private equity securities that the adviser believes have the potential for appreciation. The Fund expects to invest 60% of its net assets in publicly traded equity securities and 40% of its net assets in private equity securities. |
| General | |
| Security Type | Unlisted Closed-End Fund |
| Equity Style | -- |
| Broad Asset Class | Sector Equity |
| Broad Category | Equity |
| Global Peer Group | Equity Other |
| Peer Group | Sector Equity Funds |
| Global Macro | Equity Other |
| US Macro | -- |
| YCharts Categorization | -- |
| YCharts Benchmark | -- |
| Prospectus Objective | Sector Equity Funds |
| Fund Owner Firm Name | Capital Group/American Funds |
| Broad Asset Class Benchmark Index | |
| ^MSWNTR | 100.0% |
Fundamentals
| General | |
| Distribution Yield | -- |
| Dividend Yield TTM (5-20-26) | 0.00% |
| 30-Day SEC Yield (4-30-26) | -0.16% |
| 7-Day SEC Yield | -- |
| Number of Holdings | -- |
Fund Details
Top Portfolio Holders
| Name | % Weight |
|---|---|
| Portfolio A | 5.00% |
| Portfolio B | 3.50% |
| Portfolio C | 2.25% |