

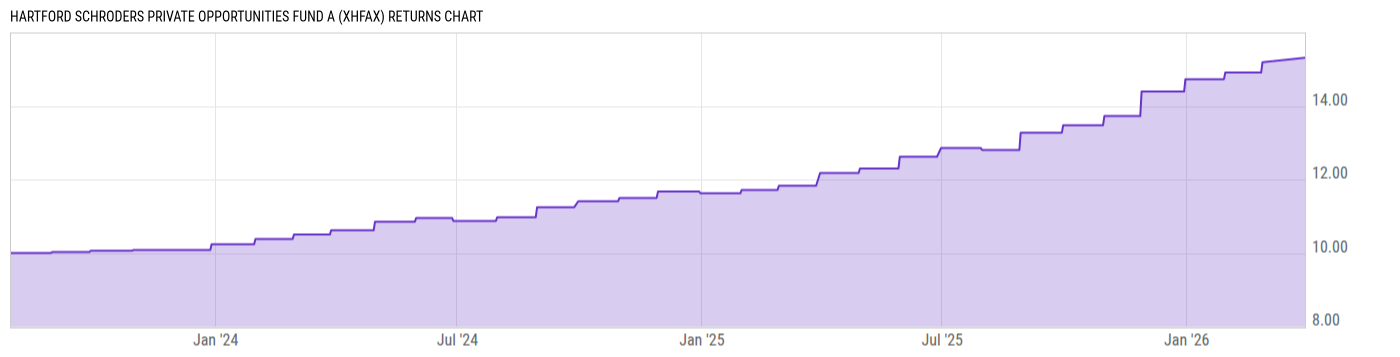
Hartford Schroders Private Opportunities Fund A (XHFAX)
14.94
+0.12
(+0.81%)
USD |
Mar 31 2026
Returns Chart
Key Stats
| Net Expense Ratio | Total Assets Under Management | Weighted Average Dividend Yield | Turnover Ratio (Generic) |
|---|---|---|---|
| 2.52% | 78.67M | -- | 0.10% |
| 1 Year Fund Level Flows | 1 Year Total Returns (Daily) | Annualized Total Returns Since Inception (Daily) | Max Drawdown (Since Inception) |
| -- | 25.76% |
Basic Info
| Investment Strategy | |
| The Fund seeks to provide long-term capital appreciation. The Fund seeks to invest in a wide range of private equity investments worldwide. The Fund will invest primarily in the equity interests of companies that are not listed on stock exchanges and that are seeking to actively build, grow, transform, or innovate. |
| General | |
| Security Type | Unlisted Closed-End Fund |
| Equity Style | -- |
| Broad Asset Class | Sector Equity |
| Broad Category | Equity |
| Global Peer Group | Equity Other |
| Peer Group | Sector Equity Funds |
| Global Macro | Equity Other |
| US Macro | -- |
| YCharts Categorization | -- |
| YCharts Benchmark | -- |
| Prospectus Objective | Sector Equity Funds |
| Fund Owner Firm Name | Hartford Funds |
| Broad Asset Class Benchmark Index | |
| ^MSWNTR | 100.0% |
Net Fund Flows Versus Peer Group
1 Month
% Rank:
--
184.54M
Peer Group Low
184.54M
Peer Group High
1 Year
% Rank:
--
2.188B
Peer Group Low
2.188B
Peer Group High
3 Months
% Rank:
--
459.53M
Peer Group Low
459.53M
Peer Group High
3 Years
% Rank:
--
3.666B
Peer Group Low
3.666B
Peer Group High
6 Months
% Rank:
--
1.039B
Peer Group Low
1.039B
Peer Group High
5 Years
% Rank:
--
--
Peer Group Low
--
Peer Group High
YTD
% Rank:
--
459.53M
Peer Group Low
459.53M
Peer Group High
10 Years
% Rank:
--
--
Peer Group Low
--
Peer Group High
Date Unavailable
Risk
Performance Versus Peer Group
Annual Total Returns Versus Peers
As of May 21, 2026.
Asset Allocation
As of December 31, 2025.
| Type | % Net |
|---|---|
| Cash | 0.80% |
| Stock | 69.46% |
| Bond | 0.00% |
| Convertible | 0.00% |
| Preferred | 5.70% |
| Other | 24.04% |
Top 10 Holdings
| Name | % Weight | Price | % Change |
|---|---|---|---|
|
Federated Hermes Prime
|
17.70% | -- | -- |
|
IGI Co Invest Fund A LP
|
7.16% | -- | -- |
|
Citation Fund I A LP
|
6.33% | -- | -- |
|
Mozzaxx Holding 3 GmbH
|
5.59% | -- | -- |
|
Investcorp India Private Equity Ltd
|
3.90% | -- | -- |
|
Vsc Safety Holdings LLC
|
3.11% | -- | -- |
|
Greenbelt Capital Partners Saber LP
|
2.92% | -- | -- |
|
Novacap International TMT VI Co-Investment (Igloo) LP
|
2.64% | -- | -- |
|
Equip Capital SPV SCSp
|
2.53% | -- | -- |
|
Atex Holdco LLC
|
2.40% | -- | -- |
Fees & Availability
| Fees | |
| Actual 12B-1 Fee | 0.70% |
| Actual Management Fee | -- |
| Administration Fee | -- |
| Maximum Front Load | 3.50% |
| Maximum Deferred Load | -- |
| Maximum Redemption Fee | -- |
| General Availability | |
| Available for Insurance Product | No |
| Available for RRSP | No |
| Purchase Details | |
| Open to New Investors |
|
| Minimum Initial Investment | 25000.00 None |
| Minimum Subsequent Investment | 10000.00 None |
Basic Info
| Investment Strategy | |
| The Fund seeks to provide long-term capital appreciation. The Fund seeks to invest in a wide range of private equity investments worldwide. The Fund will invest primarily in the equity interests of companies that are not listed on stock exchanges and that are seeking to actively build, grow, transform, or innovate. |
| General | |
| Security Type | Unlisted Closed-End Fund |
| Equity Style | -- |
| Broad Asset Class | Sector Equity |
| Broad Category | Equity |
| Global Peer Group | Equity Other |
| Peer Group | Sector Equity Funds |
| Global Macro | Equity Other |
| US Macro | -- |
| YCharts Categorization | -- |
| YCharts Benchmark | -- |
| Prospectus Objective | Sector Equity Funds |
| Fund Owner Firm Name | Hartford Funds |
| Broad Asset Class Benchmark Index | |
| ^MSWNTR | 100.0% |
Fundamentals
| General | |
| Distribution Yield | -- |
| Dividend Yield TTM (3-31-26) | 0.00% |
| 30-Day SEC Yield | -- |
| 7-Day SEC Yield | -- |
| Number of Holdings | 43 |
| Stock | |
| Weighted Average PE Ratio | -- |
| Weighted Average Price to Sales Ratio | -- |
| Weighted Average Price to Book Ratio | -- |
| Weighted Median ROE | -- |
| Weighted Median ROA | -- |
| ROI (TTM) | -- |
| Return on Investment (TTM) | -- |
| Earning Yield | -- |
| LT Debt / Shareholders Equity | -- |
| Number of Equity Holdings | 37 |
As of December 31, 2025
Growth Metrics
| EPS Growth (1Y) | -- |
| EPS Growth (3Y) | -- |
| EPS Growth (5Y) | -- |
| Sales Growth (1Y) | -- |
| Sales Growth (3Y) | -- |
| Sales Growth (5Y) | -- |
| Sales per Share Growth (1Y) | -- |
| Sales per Share Growth (3Y) | -- |
| Operating Cash Flow - Growth Rate (3Y) | -- |
As of December 31, 2025
Fund Details
Top Portfolio Holders
| Name | % Weight |
|---|---|
| Portfolio A | 5.00% |
| Portfolio B | 3.50% |
| Portfolio C | 2.25% |