

Victory Precious Metals & Mnrls Fund Fund (USAGX)
52.50
+1.66
(+3.27%)
USD |
May 08 2026
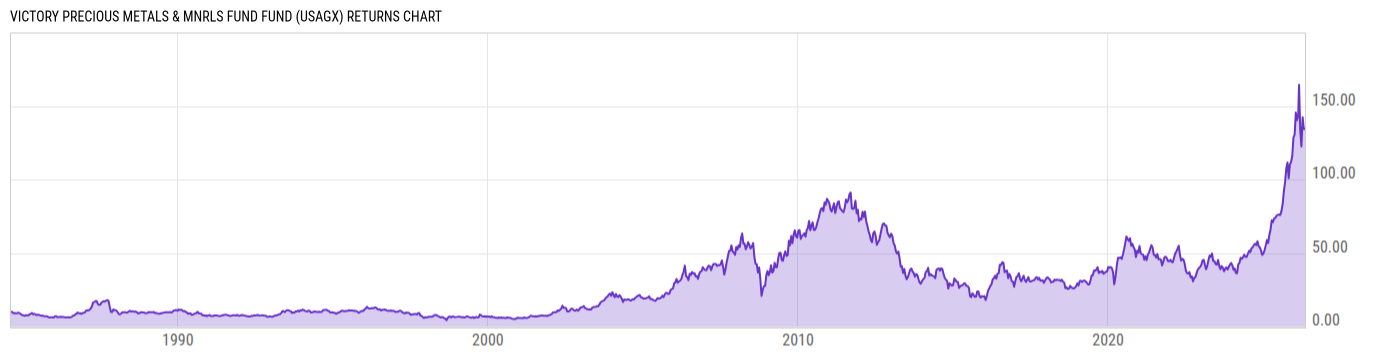
Returns Chart
Key Stats
| Net Expense Ratio | Total Assets Under Management | Weighted Average Dividend Yield | Turnover Ratio (Generic) |
|---|---|---|---|
| 1.14% | 1.234B | 1.19% | -- |
| 1 Year Fund Level Flows | 1 Year Total Returns (Daily) | Annualized Total Returns Since Inception (Daily) | Max Drawdown (Since Inception) |
| -95.42M | 88.09% |
Basic Info
| Investment Strategy | |
| The Fund seeks long-term capital appreciation and to protect the purchasing power of your capital against inflation. The Fund normally invests at least 80% of its assets in equity securities of domestic and foreign companies principally engaged in the exploration, mining, and processing of gold and other precious metals. |
| General | |
| Security Type | Mutual Fund |
| Equity Style | Multi Cap Core |
| Broad Asset Class | Sector Equity |
| Broad Category | Equity |
| Global Peer Group | Equity Sector Gold & Precious Metals |
| Peer Group | Precious Metals Equity Funds |
| Global Macro | Equity Industry Sector |
| US Macro | World Sector Equity Funds |
| YCharts Categorization | -- |
| YCharts Benchmark | -- |
| Prospectus Objective | Precious Metals Equity Funds |
| Fund Owner Firm Name | Victory Funds |
| Broad Asset Class Benchmark Index | |
| ^MSWNTR | 100.0% |
Net Fund Flows Versus Peer Group
1 Month
% Rank:
55
-228.04M
Peer Group Low
183.94M
Peer Group High
1 Year
% Rank:
70
-95.42M
-1.475B
Peer Group Low
1.377B
Peer Group High
3 Months
% Rank:
51
-1.051B
Peer Group Low
402.07M
Peer Group High
3 Years
% Rank:
74
-4.116B
Peer Group Low
1.561B
Peer Group High
6 Months
% Rank:
62
-1.475B
Peer Group Low
743.47M
Peer Group High
5 Years
% Rank:
74
-4.722B
Peer Group Low
1.749B
Peer Group High
YTD
% Rank:
44
-937.23M
Peer Group Low
941.12M
Peer Group High
10 Years
% Rank:
80
-1.488B
Peer Group Low
2.542B
Peer Group High
Date Unavailable
Risk
Performance Versus Peer Group
Annual Total Returns Versus Peers
As of May 09, 2026.
Asset Allocation
As of March 31, 2026.
| Type | % Net |
|---|---|
| Cash | 0.00% |
| Stock | 99.24% |
| Bond | 0.00% |
| Convertible | 0.00% |
| Preferred | 0.00% |
| Other | 0.75% |
Top 10 Holdings
| Name | % Weight | Price | % Change |
|---|---|---|---|
| Agnico Eagle Mines Ltd. | 13.02% | 193.21 | 2.90% |
| Gold Fields Ltd. | 7.99% | 44.86 | -0.13% |
| Kinross Gold Corp. | 7.75% | 43.13 | 3.63% |
| Newmont Corp. | 7.37% | 116.51 | 2.66% |
| Anglogold Ashanti Plc | 7.06% | 107.03 | 6.78% |
| Barrick Mining Corp. | 5.43% | 59.05 | 3.23% |
| DPM Metals, Inc. | 4.98% | 47.36 | 1.83% |
| Torex Gold Resources, Inc. | 3.80% | 50.08 | 4.64% |
| Wheaton Precious Metals Corp. | 3.69% | 138.85 | 5.54% |
| Lundin Gold, Inc. | 3.40% | 95.99 | 3.89% |
Fees & Availability
| Fees | |
| Actual 12B-1 Fee | -- |
| Actual Management Fee | 0.76% |
| Administration Fee | 753.3K% |
| Maximum Front Load | -- |
| Maximum Deferred Load | -- |
| Maximum Redemption Fee | -- |
| General Availability | |
| Available for Insurance Product | No |
| Available for RRSP | No |
| Purchase Details | |
| Open to New Investors |
|
| Minimum Initial Investment | 3000.00 None |
| Minimum Subsequent Investment | 50.00 None |
Basic Info
| Investment Strategy | |
| The Fund seeks long-term capital appreciation and to protect the purchasing power of your capital against inflation. The Fund normally invests at least 80% of its assets in equity securities of domestic and foreign companies principally engaged in the exploration, mining, and processing of gold and other precious metals. |
| General | |
| Security Type | Mutual Fund |
| Equity Style | Multi Cap Core |
| Broad Asset Class | Sector Equity |
| Broad Category | Equity |
| Global Peer Group | Equity Sector Gold & Precious Metals |
| Peer Group | Precious Metals Equity Funds |
| Global Macro | Equity Industry Sector |
| US Macro | World Sector Equity Funds |
| YCharts Categorization | -- |
| YCharts Benchmark | -- |
| Prospectus Objective | Precious Metals Equity Funds |
| Fund Owner Firm Name | Victory Funds |
| Broad Asset Class Benchmark Index | |
| ^MSWNTR | 100.0% |
Fundamentals
| General | |
| Distribution Yield | -- |
| Dividend Yield TTM (5-7-26) | 0.22% |
| 30-Day SEC Yield (3-31-26) | 0.00% |
| 7-Day SEC Yield | -- |
| Number of Holdings | 37 |
| Stock | |
| Weighted Average PE Ratio | 19.54 |
| Weighted Average Price to Sales Ratio | 7.109 |
| Weighted Average Price to Book Ratio | 4.318 |
| Weighted Median ROE | 27.17% |
| Weighted Median ROA | 18.15% |
| ROI (TTM) | 20.54% |
| Return on Investment (TTM) | 20.54% |
| Earning Yield | 0.0579 |
| LT Debt / Shareholders Equity | 0.1500 |
| Number of Equity Holdings | 33 |
As of March 31, 2026
Growth Metrics
| EPS Growth (1Y) | 85.47% |
| EPS Growth (3Y) | 61.32% |
| EPS Growth (5Y) | 27.03% |
| Sales Growth (1Y) | 46.97% |
| Sales Growth (3Y) | 25.52% |
| Sales Growth (5Y) | 18.65% |
| Sales per Share Growth (1Y) | 43.23% |
| Sales per Share Growth (3Y) | 21.79% |
| Operating Cash Flow - Growth Rate (3Y) | 42.59% |
As of March 31, 2026
Fund Details
Top Portfolio Holders
| Name | % Weight |
|---|---|
| Portfolio A | 5.00% |
| Portfolio B | 3.50% |
| Portfolio C | 2.25% |
Excel Add-In Codes
| Name: =YCI("M:USAGX", "name") |
| Broad Asset Class: =YCI("M:USAGX", "broad_asset_class") |
| Broad Category: =YCI("M:USAGX", "broad_category_group") |
| Prospectus Objective: =YCI("M:USAGX", "prospectus_objective") |
| To find the codes for any of our securities and financial metrics, see our Complete Excel Reference. |