

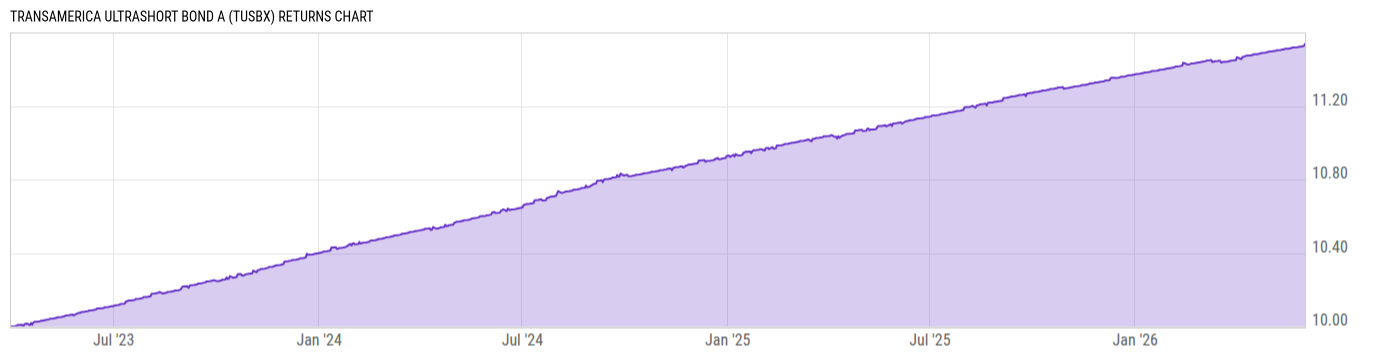
Transamerica UltraShort Bond A (TUSBX)
10.03
+0.01
(+0.10%)
USD |
Jun 02 2026
Returns Chart
Key Stats
| Net Expense Ratio | Total Assets Under Management | Weighted Average Dividend Yield | Turnover Ratio (Generic) |
|---|---|---|---|
| 0.69% | 30.87M | -- | 50.00% |
| 1 Year Fund Level Flows | 1 Year Total Returns (Daily) | Annualized Total Returns Since Inception (Daily) | Max Drawdown (Since Inception) |
| -1.019M | 3.87% |
Basic Info
| Investment Strategy | |
| The Fund seeks a high level of income consistent with minimal fluctuation in principal value and liquidity. The funds sub-adviser seeks to achieve the funds objective by investing at least 80% of the funds net assets in fixed-income securities with weighted average duration ranging from 0.25 to 1.25 years. |
| General | |
| Security Type | Mutual Fund |
| Equity Style | -- |
| Broad Asset Class | Taxable Bond |
| Broad Category | Fixed Income |
| Global Peer Group | Bond USD Short Term |
| Peer Group | Ultra-Short Obligations Funds |
| Global Macro | Bond Short Term |
| US Macro | Short/Intermediate Investment-Grade Funds |
| YCharts Categorization | -- |
| YCharts Benchmark | -- |
| Prospectus Objective | Ultra-Short Obligations Funds |
| Fund Owner Firm Name | Transamerica |
| Broad Asset Class Benchmark Index | |
| ^BBUSATR | 100.0% |
Net Fund Flows Versus Peer Group
1 Month
% Rank:
56
-533.89M
Peer Group Low
1.022B
Peer Group High
1 Year
% Rank:
61
-1.019M
-808.74M
Peer Group Low
6.874B
Peer Group High
3 Months
% Rank:
55
-352.96M
Peer Group Low
2.811B
Peer Group High
3 Years
% Rank:
52
-2.738B
Peer Group Low
10.11B
Peer Group High
6 Months
% Rank:
64
-1.072B
Peer Group Low
4.160B
Peer Group High
5 Years
% Rank:
27
-10.77B
Peer Group Low
16.65B
Peer Group High
YTD
% Rank:
63
-329.33M
Peer Group Low
3.685B
Peer Group High
10 Years
% Rank:
62
-5.237B
Peer Group Low
33.03B
Peer Group High
Date Unavailable
Risk
Performance Versus Peer Group
Annual Total Returns Versus Peers
As of June 03, 2026.
Asset Allocation
As of April 30, 2026.
| Type | % Net |
|---|---|
| Cash | 33.14% |
| Stock | 0.00% |
| Bond | 67.10% |
| Convertible | 0.00% |
| Preferred | 0.00% |
| Other | -0.24% |
Top 10 Holdings
| Name | % Weight | Price | % Change |
|---|---|---|---|
| Bank of America Corporation BACORP 5.933 09/15/2027 FLT USD Corporate '26 | 1.99% | 100.47 | -0.01% |
|
FIRST NATIONAL MASTER NOTE TRUST 232 A SFTBMAT FIX 5.77% 17-SEP-2029
|
1.95% | -- | -- |
|
AMERICAN CREDIT ACCEPTANCE RECEIVABLES TRUST 262 A FIX 08-MAY-2030
|
1.92% | -- | -- |
| TOYOTA INDUSTRIES COMMERCIAL FINANCE, INC. TOYOIND 0.0 07/13/2026 FIX USD Corporate | 1.91% | 99.54 | 0.01% |
| Bayer Corporation BYIF-Corp 0.0 07/20/2026 FIX USD Corporate | 1.90% | 99.41 | 0.01% |
|
Liberty Street Funding LLC 0% 20-OCT-2026
|
1.89% | -- | -- |
| National Bank of Canada NACN 0.0 11/13/2026 FIX USD Corporate | 1.88% | 98.20 | 0.01% |
|
AVIS BUDGET RENTAL CAR FUNDING 235 A CAM FIX 5.78% 20-APR-2028
|
1.73% | -- | -- |
| Avis Budget Rental Car Funding (Aesop) LLC AVISBU 5.44 02/20/2028 FIX USD Corporate 144A | 1.66% | 100.55 | -0.03% |
|
HERTZ VEHICLE FINANCING III LLC 212 A CAM FIX 1.68% 27-DEC-2027
|
1.65% | -- | -- |
Fees & Availability
| Fees | |
| Actual 12B-1 Fee | 0.25% |
| Actual Management Fee | -- |
| Administration Fee | -- |
| Maximum Front Load | -- |
| Maximum Deferred Load | -- |
| Maximum Redemption Fee | -- |
| General Availability | |
| Available for Insurance Product | No |
| Available for RRSP | No |
| Purchase Details | |
| Open to New Investors |
|
| Minimum Initial Investment | 1000.00 None |
| Minimum Subsequent Investment | 50.00 None |
Basic Info
| Investment Strategy | |
| The Fund seeks a high level of income consistent with minimal fluctuation in principal value and liquidity. The funds sub-adviser seeks to achieve the funds objective by investing at least 80% of the funds net assets in fixed-income securities with weighted average duration ranging from 0.25 to 1.25 years. |
| General | |
| Security Type | Mutual Fund |
| Equity Style | -- |
| Broad Asset Class | Taxable Bond |
| Broad Category | Fixed Income |
| Global Peer Group | Bond USD Short Term |
| Peer Group | Ultra-Short Obligations Funds |
| Global Macro | Bond Short Term |
| US Macro | Short/Intermediate Investment-Grade Funds |
| YCharts Categorization | -- |
| YCharts Benchmark | -- |
| Prospectus Objective | Ultra-Short Obligations Funds |
| Fund Owner Firm Name | Transamerica |
| Broad Asset Class Benchmark Index | |
| ^BBUSATR | 100.0% |
Fundamentals
| General | |
| Distribution Yield | -- |
| Dividend Yield TTM (6-1-26) | 3.67% |
| 30-Day SEC Yield (4-30-26) | 3.45% |
| 7-Day SEC Yield | -- |
| Number of Holdings | 111 |
| Bond | |
| Yield to Maturity (4-30-26) | 4.26% |
| Effective Duration | -- |
| Average Coupon | 4.33% |
| Calculated Average Quality | 2.566 |
| Effective Maturity | 2.612 |
| Nominal Maturity | 2.661 |
| Number of Bond Holdings | 84 |
As of April 30, 2026
Fund Details
| Key Dates | |
| Inception Date | 3/31/2023 |
| Last Annual Report Date | 10/31/2025 |
| Last Prospectus Date | 3/1/2025 |
| Share Classes | |
| TUSFX | Inst |
| Attributes | |
| Index Fund | -- |
| Inverse Fund | No |
| Leveraged Fund | -- |
| Fund of Funds | No |
| Currency Hedged Fund | -- |
| Socially Responsible Fund | No |
Top Portfolio Holders
| Name | % Weight |
|---|---|
| Portfolio A | 5.00% |
| Portfolio B | 3.50% |
| Portfolio C | 2.25% |
Excel Add-In Codes
| Name: =YCI("M:TUSBX", "name") |
| Broad Asset Class: =YCI("M:TUSBX", "broad_asset_class") |
| Broad Category: =YCI("M:TUSBX", "broad_category_group") |
| Prospectus Objective: =YCI("M:TUSBX", "prospectus_objective") |
| To find the codes for any of our securities and financial metrics, see our Complete Excel Reference. |