

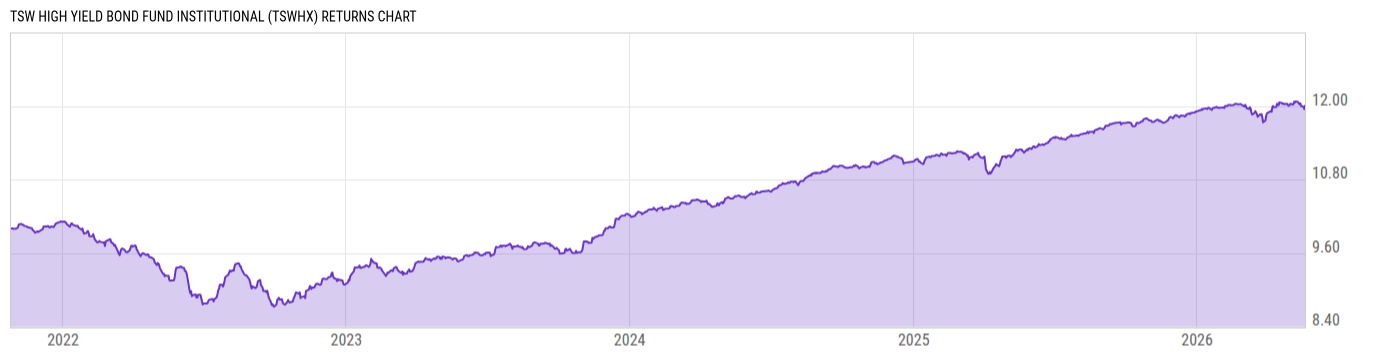
TSW High Yield Bond Fund Institutional (TSWHX)
9.20
-0.03
(-0.32%)
USD |
May 19 2026
Returns Chart
Key Stats
| Net Expense Ratio | Total Assets Under Management | Weighted Average Dividend Yield | Turnover Ratio (Generic) |
|---|---|---|---|
| 0.65% | 9.153M | -- | 44.00% |
| 1 Year Fund Level Flows | 1 Year Total Returns (Daily) | Annualized Total Returns Since Inception (Daily) | Max Drawdown (Since Inception) |
| -913352.0 | 5.86% |
Basic Info
| Investment Strategy | |
| The Fund seeks high current income with a secondary focus on capital appreciation. The Fund will be investing, under normal circumstances, at least 80% of its net assets (including the amount of any borrowings for investment purposes) in high yield fixed income securities, also known as junk bonds. |
| General | |
| Security Type | Mutual Fund |
| Equity Style | -- |
| Broad Asset Class | Taxable Bond |
| Broad Category | Fixed Income |
| Global Peer Group | Bond USD High Yield |
| Peer Group | High Yield Funds |
| Global Macro | Bond High Yield |
| US Macro | High Yield Funds |
| YCharts Categorization | -- |
| YCharts Benchmark | -- |
| Prospectus Objective | High Yield Funds |
| Fund Owner Firm Name | JOHCM |
| Broad Asset Class Benchmark Index | |
| ^BBUSATR | 100.0% |
Net Fund Flows Versus Peer Group
1 Month
% Rank:
46
-246.22M
Peer Group Low
1.905B
Peer Group High
1 Year
% Rank:
37
-913352.0
-2.757B
Peer Group Low
12.05B
Peer Group High
3 Months
% Rank:
35
-1.206B
Peer Group Low
754.76M
Peer Group High
3 Years
% Rank:
41
-4.269B
Peer Group Low
12.80B
Peer Group High
6 Months
% Rank:
33
-2.219B
Peer Group Low
1.746B
Peer Group High
5 Years
% Rank:
32
-7.728B
Peer Group Low
14.73B
Peer Group High
YTD
% Rank:
34
-3.074B
Peer Group Low
1.049B
Peer Group High
10 Years
% Rank:
35
-10.71B
Peer Group Low
21.54B
Peer Group High
Date Unavailable
Risk
Performance Versus Peer Group
Annual Total Returns Versus Peers
As of May 20, 2026.
Asset Allocation
As of March 31, 2026.
| Type | % Net |
|---|---|
| Cash | 2.38% |
| Stock | 0.00% |
| Bond | 97.62% |
| Convertible | 0.00% |
| Preferred | 0.00% |
| Other | 0.00% |
Top 10 Holdings
| Name | % Weight | Price | % Change |
|---|---|---|---|
| FTAI AVIATION INVESTORS LLC FTAIAV 7.0 06/15/2032 FIX USD Corporate 144A | 3.38% | 102.56 | -0.45% |
| Bath & Body Works, Inc. BATHB 6.875 11/01/2035 FIX USD Corporate | 3.24% | 96.65 | -0.44% |
| Iron Mountain Incorporated IRONMOAF 6.25 01/15/2033 FIX USD Corporate 144A | 2.74% | 100.30 | -0.47% |
| Graphic Packaging International, LLC GRAPHIP 6.375 07/15/2032 FIX USD Corporate 144A | 2.73% | 100.03 | -0.05% |
| American Axle & Manufacturing, Inc. AXL-Inc 7.75 10/15/2033 FIX USD Corporate 144A | 2.67% | 98.40 | -0.45% |
| Gen Digital Inc. GENDIG 6.25 04/01/2033 FIX USD Corporate 144A | 2.67% | 98.24 | -0.18% |
| STONEX GROUP INC. STONEXG 7.875 03/01/2031 FIX USD Corporate 144A | 2.57% | 104.74 | -0.14% |
| Herc Holdings Inc. HERCHOL 7.25 06/15/2033 FIX USD Corporate 144A | 2.25% | 103.53 | -0.13% |
| Northern Treasury Portfolio Premier | 2.25% | 1.00 | 0.00% |
| J B Poindexter & Co Inc JBPOIN 8.75 12/15/2031 FIX USD Corporate 144A | 2.23% | 99.54 | -0.25% |
Fees & Availability
| Fees | |
| Actual 12B-1 Fee | -- |
| Actual Management Fee | -- |
| Administration Fee | 20.49K% |
| Maximum Front Load | -- |
| Maximum Deferred Load | -- |
| Maximum Redemption Fee | -- |
| General Availability | |
| Available for Insurance Product | No |
| Available for RRSP | No |
| Purchase Details | |
| Open to New Investors |
|
| Minimum Initial Investment | 100000.0 None |
| Minimum Subsequent Investment | 0.00 None |
Basic Info
| Investment Strategy | |
| The Fund seeks high current income with a secondary focus on capital appreciation. The Fund will be investing, under normal circumstances, at least 80% of its net assets (including the amount of any borrowings for investment purposes) in high yield fixed income securities, also known as junk bonds. |
| General | |
| Security Type | Mutual Fund |
| Equity Style | -- |
| Broad Asset Class | Taxable Bond |
| Broad Category | Fixed Income |
| Global Peer Group | Bond USD High Yield |
| Peer Group | High Yield Funds |
| Global Macro | Bond High Yield |
| US Macro | High Yield Funds |
| YCharts Categorization | -- |
| YCharts Benchmark | -- |
| Prospectus Objective | High Yield Funds |
| Fund Owner Firm Name | JOHCM |
| Broad Asset Class Benchmark Index | |
| ^BBUSATR | 100.0% |
Fundamentals
| General | |
| Distribution Yield | -- |
| Dividend Yield TTM (5-18-26) | 6.01% |
| 30-Day SEC Yield (4-30-26) | 6.14% |
| 7-Day SEC Yield | -- |
| Number of Holdings | 60 |
| Bond | |
| Yield to Maturity (3-31-26) | 6.32% |
| Effective Duration | 2.70 |
| Average Coupon | 7.16% |
| Calculated Average Quality | 5.385 |
| Effective Maturity | 5.217 |
| Nominal Maturity | 5.943 |
| Number of Bond Holdings | 54 |
As of March 31, 2026
Fund Details
| Key Dates | |
| Inception Date | 10/26/2021 |
| Last Annual Report Date | 9/30/2025 |
| Last Prospectus Date | 2/1/2026 |
| Attributes | |
| Index Fund | -- |
| Inverse Fund | No |
| Leveraged Fund | -- |
| Fund of Funds | No |
| Currency Hedged Fund | -- |
| Socially Responsible Fund | No |
Top Portfolio Holders
| Name | % Weight |
|---|---|
| Portfolio A | 5.00% |
| Portfolio B | 3.50% |
| Portfolio C | 2.25% |
Excel Add-In Codes
| Name: =YCI("M:TSWHX", "name") |
| Broad Asset Class: =YCI("M:TSWHX", "broad_asset_class") |
| Broad Category: =YCI("M:TSWHX", "broad_category_group") |
| Prospectus Objective: =YCI("M:TSWHX", "prospectus_objective") |
| To find the codes for any of our securities and financial metrics, see our Complete Excel Reference. |