

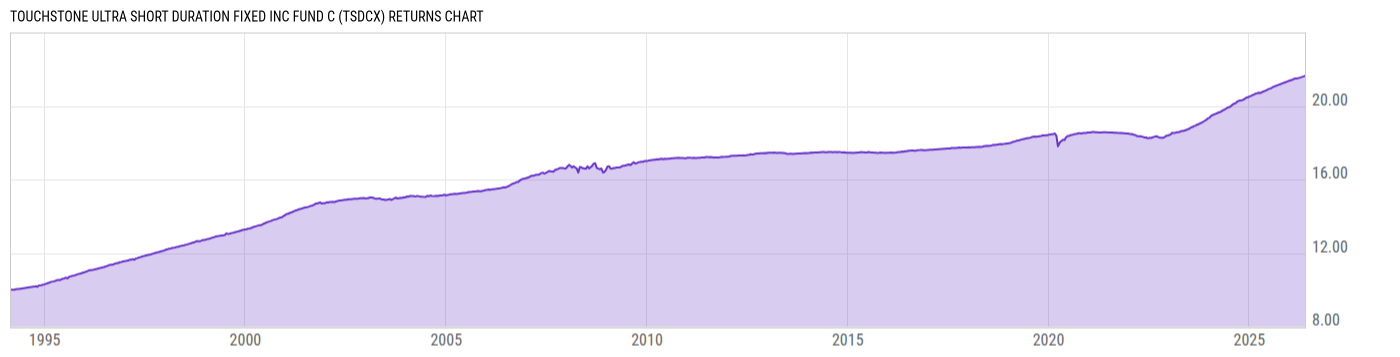
Touchstone Ultra Short Duration Fixed Inc Fund C (TSDCX)
9.23
0.00 (0.00%)
USD |
May 22 2026
Returns Chart
Key Stats
| Net Expense Ratio | Total Assets Under Management | Weighted Average Dividend Yield | Turnover Ratio (Generic) |
|---|---|---|---|
| 1.14% | 1.019B | -- | 80.00% |
| 1 Year Fund Level Flows | 1 Year Total Returns (Daily) | Annualized Total Returns Since Inception (Daily) | Max Drawdown (Since Inception) |
| 164.49M | 3.80% |
Basic Info
| Investment Strategy | |
| The Fund seeks maximum total return consistent with preservation of capital. The Fund invests, under normal market conditions, at least 80% of its assets in fixed-income securities and invests only in investment-grade debt securities. The Funds investment policies are based on credit ratings at the time of purchase. |
| General | |
| Security Type | Mutual Fund |
| Equity Style | -- |
| Broad Asset Class | Taxable Bond |
| Broad Category | Fixed Income |
| Global Peer Group | Bond USD Short Term |
| Peer Group | Ultra-Short Obligations Funds |
| Global Macro | Bond Short Term |
| US Macro | Short/Intermediate Investment-Grade Funds |
| YCharts Categorization | -- |
| YCharts Benchmark | -- |
| Prospectus Objective | Ultra-Short Obligations Funds |
| Fund Owner Firm Name | Touchstone Investments |
| Broad Asset Class Benchmark Index | |
| ^BBUSATR | 100.0% |
Net Fund Flows Versus Peer Group
1 Month
% Rank:
64
-533.89M
Peer Group Low
1.093B
Peer Group High
1 Year
% Rank:
36
164.49M
-808.74M
Peer Group Low
6.324B
Peer Group High
3 Months
% Rank:
38
-436.50M
Peer Group Low
2.286B
Peer Group High
3 Years
% Rank:
24
-3.158B
Peer Group Low
9.909B
Peer Group High
6 Months
% Rank:
36
-1.072B
Peer Group Low
3.605B
Peer Group High
5 Years
% Rank:
49
-11.32B
Peer Group Low
16.13B
Peer Group High
YTD
% Rank:
32
-362.21M
Peer Group Low
2.670B
Peer Group High
10 Years
% Rank:
58
-4.983B
Peer Group Low
32.35B
Peer Group High
Date Unavailable
Risk
Performance Versus Peer Group
Annual Total Returns Versus Peers
As of May 23, 2026.
Asset Allocation
As of March 31, 2026.
| Type | % Net |
|---|---|
| Cash | 3.75% |
| Stock | 0.00% |
| Bond | 95.99% |
| Convertible | 0.00% |
| Preferred | 0.00% |
| Other | 0.25% |
Top 10 Holdings
| Name | % Weight | Price | % Change |
|---|---|---|---|
| SANTANDER DRIVE AUTO RECEIVABLES TRUST 2025-4 SANTDRGG 4.17 04/15/2030 FIX USD Corporate | 1.89% | 99.71 | 0.01% |
| BERRY GLOBAL, INC. BERRGLO 1.65 01/15/2027 FIX USD Corporate | 1.65% | 98.43 | 0.12% |
| United States of America USGB 3.375 02/29/2028 FIX USD Government | 1.55% | 98.77 | -0.08% |
| Global Payments Inc. GLP 04/01/2026 FIX USD Corporate (Matured) | 1.53% | 100.00 | -0.00% |
| HCA Inc. HCA 5.25 06/15/2026 FIX USD Corporate | 1.44% | 100.00 | -0.00% |
|
MORGAN STANLEY CAPITAL I TRUST 17H1 AS SEQ FIX 3.773% 17-JUN-2050
|
1.38% | -- | -- |
|
J.P. MORGAN CHASE COMMERCIAL MORTGAGE SECURITIES TRUST 16NINE A SEQ FIX 2.8541% 09-SEP-2038
|
1.37% | -- | -- |
|
VEGAS TRUST 24TI A SEQ FIX 5.5183% 10-NOV-2039
|
1.32% | -- | -- |
|
ONEMAIN FINANCIAL ISSUANCE TRUST 192 A SEQ FIX 3.14% 14-OCT-2036
|
1.30% | -- | -- |
| Ametek, Inc. AME 04/01/2026 FIX USD Corporate (Matured) | 1.28% | -- | -- |
Fees & Availability
| Fees | |
| Actual 12B-1 Fee | 0.75% |
| Actual Management Fee | -- |
| Administration Fee | 7.27K% |
| Maximum Front Load | -- |
| Maximum Deferred Load | 1.00% |
| Maximum Redemption Fee | -- |
| General Availability | |
| Available for Insurance Product | No |
| Available for RRSP | No |
| Purchase Details | |
| Open to New Investors |
|
| Minimum Initial Investment | 2500.00 None |
| Minimum Subsequent Investment | 50.00 None |
Basic Info
| Investment Strategy | |
| The Fund seeks maximum total return consistent with preservation of capital. The Fund invests, under normal market conditions, at least 80% of its assets in fixed-income securities and invests only in investment-grade debt securities. The Funds investment policies are based on credit ratings at the time of purchase. |
| General | |
| Security Type | Mutual Fund |
| Equity Style | -- |
| Broad Asset Class | Taxable Bond |
| Broad Category | Fixed Income |
| Global Peer Group | Bond USD Short Term |
| Peer Group | Ultra-Short Obligations Funds |
| Global Macro | Bond Short Term |
| US Macro | Short/Intermediate Investment-Grade Funds |
| YCharts Categorization | -- |
| YCharts Benchmark | -- |
| Prospectus Objective | Ultra-Short Obligations Funds |
| Fund Owner Firm Name | Touchstone Investments |
| Broad Asset Class Benchmark Index | |
| ^BBUSATR | 100.0% |
Fundamentals
| General | |
| Distribution Yield | -- |
| Dividend Yield TTM (5-21-26) | 3.91% |
| 30-Day SEC Yield (4-30-26) | 3.12% |
| 7-Day SEC Yield | -- |
| Number of Holdings | 289 |
| Bond | |
| Yield to Maturity (3-31-26) | 4.07% |
| Effective Duration | 0.60 |
| Average Coupon | 4.50% |
| Calculated Average Quality | 2.445 |
| Effective Maturity | 9.017 |
| Nominal Maturity | 9.075 |
| Number of Bond Holdings | 280 |
As of March 31, 2026
Fund Details
Top Portfolio Holders
| Name | % Weight |
|---|---|
| Portfolio A | 5.00% |
| Portfolio B | 3.50% |
| Portfolio C | 2.25% |
Excel Add-In Codes
| Name: =YCI("M:TSDCX", "name") |
| Broad Asset Class: =YCI("M:TSDCX", "broad_asset_class") |
| Broad Category: =YCI("M:TSDCX", "broad_category_group") |
| Prospectus Objective: =YCI("M:TSDCX", "prospectus_objective") |
| To find the codes for any of our securities and financial metrics, see our Complete Excel Reference. |