

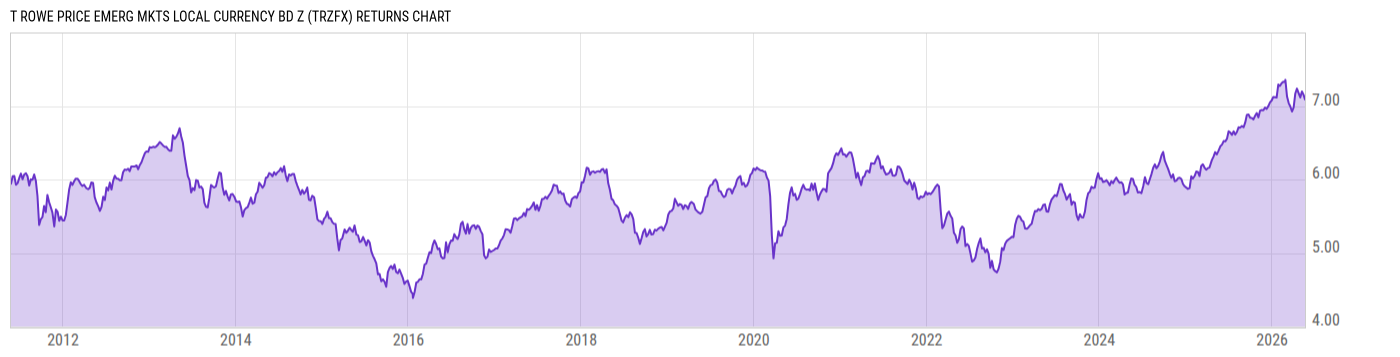
T Rowe Price Emerg Mkts Local Currency Bd Z (TRZFX)
4.97
-0.02
(-0.40%)
USD |
Jun 08 2026
Returns Chart
Key Stats
| Net Expense Ratio | Total Assets Under Management | Weighted Average Dividend Yield | Turnover Ratio (Generic) |
|---|---|---|---|
| 0.00% | 461.56M | -- | 82.00% |
| 1 Year Fund Level Flows | 1 Year Total Returns (Daily) | Annualized Total Returns Since Inception (Daily) | Max Drawdown (Since Inception) |
| 146.04M | 8.90% |
Basic Info
| Investment Strategy | |
| The Fund seeks to provide high income and capital appreciation. Under normal conditions, at least 80% of the funds net assets will be invested in bonds that are denominated in emerging markets currencies, and in derivative instruments that provide investment exposure to such securities. |
| General | |
| Security Type | Mutual Fund |
| Equity Style | -- |
| Broad Asset Class | Taxable Bond |
| Broad Category | Fixed Income |
| Global Peer Group | Bond Emerging Markets Global LC |
| Peer Group | Emerging Markets Local Currency Debt Fds |
| Global Macro | Bond Emerging Markets |
| US Macro | Emerging Markets Debt Funds |
| YCharts Categorization | -- |
| YCharts Benchmark | -- |
| Prospectus Objective | Emerging Markets Local Currency Debt Fds |
| Fund Owner Firm Name | T. Rowe Price |
| Broad Asset Class Benchmark Index | |
| ^BBUSATR | 100.0% |
Net Fund Flows Versus Peer Group
1 Month
% Rank:
27
-77.34M
Peer Group Low
220.55M
Peer Group High
1 Year
% Rank:
30
146.04M
-30.48M
Peer Group Low
1.580B
Peer Group High
3 Months
% Rank:
20
-232.60M
Peer Group Low
131.48M
Peer Group High
3 Years
% Rank:
40
-106.69M
Peer Group Low
2.419B
Peer Group High
6 Months
% Rank:
27
-24.39M
Peer Group Low
652.93M
Peer Group High
5 Years
% Rank:
77
-184.29M
Peer Group Low
2.686B
Peer Group High
YTD
% Rank:
27
-22.77M
Peer Group Low
631.53M
Peer Group High
10 Years
% Rank:
23
-1.797B
Peer Group Low
3.647B
Peer Group High
Date Unavailable
Risk
Performance Versus Peer Group
Annual Total Returns Versus Peers
As of June 09, 2026.
Asset Allocation
As of March 31, 2026.
| Type | % Net |
|---|---|
| Cash | 3.72% |
| Stock | 0.16% |
| Bond | 94.78% |
| Convertible | 0.00% |
| Preferred | 0.00% |
| Other | 1.34% |
Top 10 Holdings
| Name | % Weight | Price | % Change |
|---|---|---|---|
|
Brazil, Federative Republic of (Government) 10% 01-JAN-2031
|
4.42% | -- | -- |
| T Rowe Price Government Money Fund | 4.32% | 1.00 | 0.00% |
|
United Mexican States (Mexico) (Government) 8.5% 28-FEB-2030
|
3.77% | -- | -- |
|
South Africa, Republic of (Government) 8.75% 31-JAN-2044
|
2.61% | -- | -- |
|
Czech Republic (Government) 2% 13-OCT-2033
|
2.23% | -- | -- |
|
Romania (Government) 5% 12-FEB-2029
|
2.15% | -- | -- |
|
Indonesia, Republic of (Government) 6.375% 15-APR-2032
|
2.09% | -- | -- |
|
Hungary (Government) 4.5% 23-MAR-2028
|
2.07% | -- | -- |
|
Other Assets less Liabilities
|
1.97% | -- | -- |
|
India, Republic of (Government) 7.26% 06-FEB-2033
|
1.76% | -- | -- |
Fees & Availability
| Fees | |
| Actual 12B-1 Fee | -- |
| Actual Management Fee | 0.59% |
| Administration Fee | -- |
| Maximum Front Load | -- |
| Maximum Deferred Load | -- |
| Maximum Redemption Fee | -- |
| General Availability | |
| Available for Insurance Product | No |
| Available for RRSP | No |
| Purchase Details | |
| Open to New Investors |
|
| Minimum Initial Investment | 0.00 None |
| Minimum Subsequent Investment | 0.00 None |
Basic Info
| Investment Strategy | |
| The Fund seeks to provide high income and capital appreciation. Under normal conditions, at least 80% of the funds net assets will be invested in bonds that are denominated in emerging markets currencies, and in derivative instruments that provide investment exposure to such securities. |
| General | |
| Security Type | Mutual Fund |
| Equity Style | -- |
| Broad Asset Class | Taxable Bond |
| Broad Category | Fixed Income |
| Global Peer Group | Bond Emerging Markets Global LC |
| Peer Group | Emerging Markets Local Currency Debt Fds |
| Global Macro | Bond Emerging Markets |
| US Macro | Emerging Markets Debt Funds |
| YCharts Categorization | -- |
| YCharts Benchmark | -- |
| Prospectus Objective | Emerging Markets Local Currency Debt Fds |
| Fund Owner Firm Name | T. Rowe Price |
| Broad Asset Class Benchmark Index | |
| ^BBUSATR | 100.0% |
Fundamentals
| General | |
| Distribution Yield | -- |
| Dividend Yield TTM (6-5-26) | 7.23% |
| 30-Day SEC Yield (4-30-26) | 7.55% |
| 7-Day SEC Yield | -- |
| Number of Holdings | 204 |
| Bond | |
| Yield to Maturity (3-31-26) | 6.82% |
| Effective Duration | 5.08 |
| Average Coupon | 6.58% |
| Calculated Average Quality | 4.001 |
| Effective Maturity | 8.162 |
| Nominal Maturity | 8.162 |
| Number of Bond Holdings | 141 |
As of March 31, 2026
Fund Details
Top Portfolio Holders
| Name | % Weight |
|---|---|
| Portfolio A | 5.00% |
| Portfolio B | 3.50% |
| Portfolio C | 2.25% |
Excel Add-In Codes
| Name: =YCI("M:TRZFX", "name") |
| Broad Asset Class: =YCI("M:TRZFX", "broad_asset_class") |
| Broad Category: =YCI("M:TRZFX", "broad_category_group") |
| Prospectus Objective: =YCI("M:TRZFX", "prospectus_objective") |
| To find the codes for any of our securities and financial metrics, see our Complete Excel Reference. |