

Nuveen Large Cap Value Fund Premier (TRCPX)
26.50
+0.19
(+0.72%)
USD |
Jun 09 2026
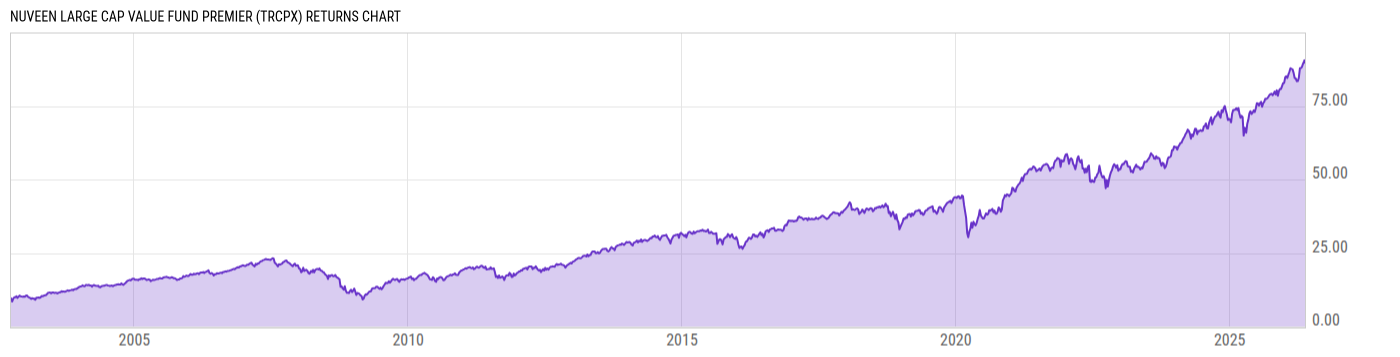
Returns Chart
Key Stats
| Net Expense Ratio | Total Assets Under Management | Weighted Average Dividend Yield | Turnover Ratio (Generic) |
|---|---|---|---|
| 0.55% | 6.322B | 1.69% | 17.00% |
| 1 Year Fund Level Flows | 1 Year Total Returns (Daily) | Annualized Total Returns Since Inception (Daily) | Max Drawdown (Since Inception) |
| -1.480B | 25.03% |
Basic Info
| Investment Strategy | |
| The Fund seeks a favorable long-term total return, mainly through capital appreciation, primarily from equity securities of large domestic companies that appear undervalued by the market. The Fund's benchmark is the Russell 1000 Value Index. |
| General | |
| Security Type | Mutual Fund |
| Equity Style | Large Cap Value |
| Broad Asset Class | US Equity |
| Broad Category | Equity |
| Global Peer Group | Equity US |
| Peer Group | Large-Cap Value Funds |
| Global Macro | Equity North America |
| US Macro | Large-Cap Funds |
| YCharts Categorization | -- |
| YCharts Benchmark | -- |
| Prospectus Objective | -- |
| Fund Owner Firm Name | Nuveen |
| Broad Asset Class Benchmark Index | |
| ^SPXTR | 100.0% |
Net Fund Flows Versus Peer Group
1 Month
% Rank:
82
-2.054B
Peer Group Low
762.58M
Peer Group High
1 Year
% Rank:
81
-1.480B
-11.38B
Peer Group Low
3.607B
Peer Group High
3 Months
% Rank:
81
-3.984B
Peer Group Low
866.43M
Peer Group High
3 Years
% Rank:
74
-30.28B
Peer Group Low
19.54B
Peer Group High
6 Months
% Rank:
82
-7.675B
Peer Group Low
2.255B
Peer Group High
5 Years
% Rank:
78
-41.75B
Peer Group Low
19.54B
Peer Group High
YTD
% Rank:
81
-6.233B
Peer Group Low
2.177B
Peer Group High
10 Years
% Rank:
86
-42.23B
Peer Group Low
19.54B
Peer Group High
Date Unavailable
Risk
Performance Versus Peer Group
Annual Total Returns Versus Peers
As of June 10, 2026.
Asset Allocation
As of March 31, 2026.
| Type | % Net |
|---|---|
| Cash | 0.29% |
| Stock | 99.58% |
| Bond | 0.00% |
| Convertible | 0.00% |
| Preferred | 0.00% |
| Other | 0.13% |
Top 10 Holdings
| Name | % Weight | Price | % Change |
|---|---|---|---|
| Alphabet, Inc. | 4.17% | 362.29 | 0.31% |
| JPMorgan Chase & Co. | 3.82% | 312.70 | 0.51% |
| Johnson & Johnson | 3.18% | 237.00 | 2.08% |
| Exxon Mobil Corp. | 2.68% | 148.91 | -1.87% |
| Berkshire Hathaway, Inc. | 2.41% | 487.77 | 0.16% |
| RTX Corp. | 2.29% | 181.56 | 1.62% |
| Bank of America Corp. | 2.11% | 54.42 | 1.47% |
| Amazon.com, Inc. | 2.11% | 244.19 | -0.42% |
| Linde Plc | 1.99% | 515.59 | 2.72% |
| Wells Fargo & Co. | 1.98% | 82.00 | 1.28% |
Fees & Availability
| Fees | |
| Actual 12B-1 Fee | 0.15% |
| Actual Management Fee | 0.39% |
| Administration Fee | -- |
| Maximum Front Load | -- |
| Maximum Deferred Load | -- |
| Maximum Redemption Fee | 0.00% |
| General Availability | |
| Available for Insurance Product | No |
| Available for RRSP | No |
| Purchase Details | |
| Open to New Investors |
|
| Minimum Initial Investment | 0.00 None |
| Minimum Subsequent Investment | 0.00 None |
Basic Info
| Investment Strategy | |
| The Fund seeks a favorable long-term total return, mainly through capital appreciation, primarily from equity securities of large domestic companies that appear undervalued by the market. The Fund's benchmark is the Russell 1000 Value Index. |
| General | |
| Security Type | Mutual Fund |
| Equity Style | Large Cap Value |
| Broad Asset Class | US Equity |
| Broad Category | Equity |
| Global Peer Group | Equity US |
| Peer Group | Large-Cap Value Funds |
| Global Macro | Equity North America |
| US Macro | Large-Cap Funds |
| YCharts Categorization | -- |
| YCharts Benchmark | -- |
| Prospectus Objective | -- |
| Fund Owner Firm Name | Nuveen |
| Broad Asset Class Benchmark Index | |
| ^SPXTR | 100.0% |
Fundamentals
| General | |
| Distribution Yield | -- |
| Dividend Yield TTM (6-8-26) | 1.38% |
| 30-Day SEC Yield | -- |
| 7-Day SEC Yield | -- |
| Number of Holdings | 79 |
| Stock | |
| Weighted Average PE Ratio | 25.61 |
| Weighted Average Price to Sales Ratio | 4.711 |
| Weighted Average Price to Book Ratio | 5.132 |
| Weighted Median ROE | 221.0% |
| Weighted Median ROA | 8.26% |
| ROI (TTM) | 14.42% |
| Return on Investment (TTM) | 14.42% |
| Earning Yield | 0.0457 |
| LT Debt / Shareholders Equity | 0.7903 |
| Number of Equity Holdings | 76 |
As of March 31, 2026
Growth Metrics
| EPS Growth (1Y) | 15.95% |
| EPS Growth (3Y) | 8.26% |
| EPS Growth (5Y) | 15.86% |
| Sales Growth (1Y) | 7.22% |
| Sales Growth (3Y) | 5.44% |
| Sales Growth (5Y) | 9.27% |
| Sales per Share Growth (1Y) | 8.11% |
| Sales per Share Growth (3Y) | 6.79% |
| Operating Cash Flow - Growth Rate (3Y) | 8.56% |
As of March 31, 2026
Fund Details
| Key Dates | |
| Inception Date | 10/1/2002 |
| Last Annual Report Date | 10/31/2025 |
| Last Prospectus Date | 2/27/2026 |
| Share Classes | |
| TCLCX | A |
| TRLCX | Retirement |
| TRLHX | Inst |
| TRLIX | Retirement |
| TRLWX | Other |
| Attributes | |
| Index Fund | -- |
| Inverse Fund | No |
| Leveraged Fund | -- |
| Fund of Funds | No |
| Currency Hedged Fund | -- |
| Socially Responsible Fund | No |
Top Portfolio Holders
| Name | % Weight |
|---|---|
| Portfolio A | 5.00% |
| Portfolio B | 3.50% |
| Portfolio C | 2.25% |
Excel Add-In Codes
| Name: =YCI("M:TRCPX", "name") |
| Broad Asset Class: =YCI("M:TRCPX", "broad_asset_class") |
| Broad Category: =YCI("M:TRCPX", "broad_category_group") |
| Prospectus Objective: =YCI("M:TRCPX", "prospectus_objective") |
| To find the codes for any of our securities and financial metrics, see our Complete Excel Reference. |