

Alternative Credit Income Fund I (RCIIX)
9.02
0.00 (0.00%)
USD |
May 21 2026
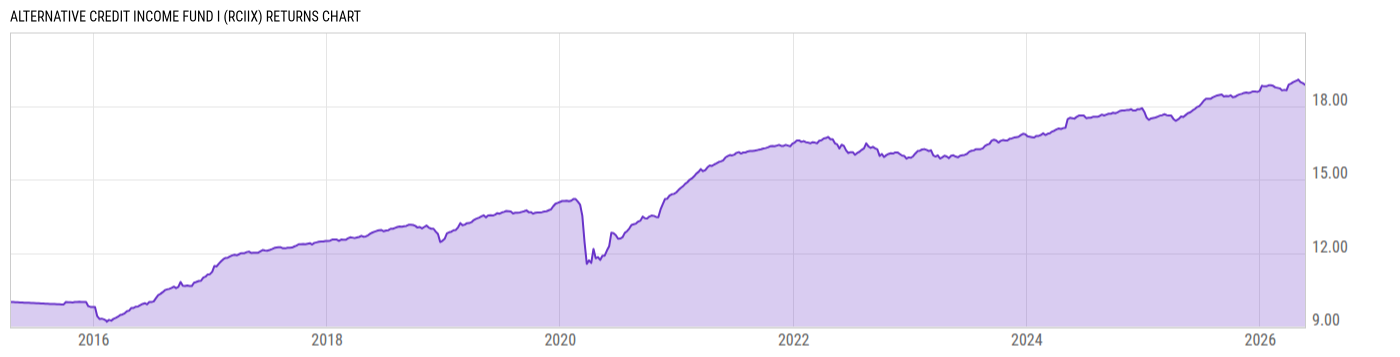
Returns Chart
Key Stats
| Net Expense Ratio | Total Assets Under Management | Weighted Average Dividend Yield | Turnover Ratio (Generic) |
|---|---|---|---|
| 4.29% | 176.96M | -- | -- |
| 1 Year Fund Level Flows | 1 Year Total Returns (Daily) | Annualized Total Returns Since Inception (Daily) | Max Drawdown (Since Inception) |
| -- | 6.35% |
Basic Info
| Investment Strategy | |
| The Fund seeks current income, with a secondary objective to achieve long-term capital appreciation with moderate volatility and low to moderate correlation to the broader equity markets. The Fund invests at least 80% of its assets in fixed-income and fixed-income related securities, as described in this prospectus. |
| General | |
| Security Type | Unlisted Closed-End Fund |
| Equity Style | -- |
| Broad Asset Class | Taxable Bond |
| Broad Category | Fixed Income |
| Global Peer Group | Bond USD |
| Peer Group | General Bond Funds |
| Global Macro | Bond HC |
| US Macro | General Domestic Taxable Fixed Income Funds |
| YCharts Categorization | -- |
| YCharts Benchmark | -- |
| Prospectus Objective | General Bond Funds |
| Fund Owner Firm Name | Alternative Credit Income Fund |
| Broad Asset Class Benchmark Index | |
| ^BBUSATR | 100.0% |
Net Fund Flows Versus Peer Group
1 Month
% Rank:
--
-3.511B
Peer Group Low
288.35M
Peer Group High
1 Year
% Rank:
--
-641.24M
Peer Group Low
13.23B
Peer Group High
3 Months
% Rank:
--
-2.235B
Peer Group Low
1.456B
Peer Group High
3 Years
% Rank:
--
-12.70B
Peer Group Low
18.00B
Peer Group High
6 Months
% Rank:
--
-3.509B
Peer Group Low
2.976B
Peer Group High
5 Years
% Rank:
--
-1.455B
Peer Group Low
49.86B
Peer Group High
YTD
% Rank:
--
-2.080B
Peer Group Low
2.002B
Peer Group High
10 Years
% Rank:
--
-1.866B
Peer Group Low
81.23B
Peer Group High
Date Unavailable
Risk
Performance Versus Peer Group
Annual Total Returns Versus Peers
As of May 22, 2026.
Asset Allocation
As of February 28, 2026.
| Type | % Net |
|---|---|
| Cash | 2.01% |
| Stock | 11.09% |
| Bond | 93.31% |
| Convertible | 0.00% |
| Preferred | 3.99% |
| Other | -10.40% |
Top 10 Holdings
| Name | % Weight | Price | % Change |
|---|---|---|---|
|
Tree Line Credit Strategies LP Perp 11.000%
|
9.82% | -- | -- |
|
Next Flight Ventures FRN 26-Dec-2026
|
3.69% | -- | -- |
|
Upstream Rehabilitation Inc FRN 20-May-2030
|
3.66% | -- | -- |
|
Hunter Point Capital LP FRN 15-Jul-2052
|
3.56% | -- | -- |
|
Money Transfer Acquisition Inc FRN 14-Dec-2027
|
3.25% | -- | -- |
|
BlackRock Global Credit Opportunities Fund LP
|
3.12% | -- | -- |
|
Diamanti Inc FRN 01-Apr-2026
|
2.97% | -- | -- |
|
Marvel APS FRN 21-Dec-2027
|
2.93% | -- | -- |
|
American Academy Holdings LLC FRN 01-Mar-2028
|
2.83% | -- | -- |
|
Phillips Feed Service Inc FRN 31-Dec-2026
|
2.77% | -- | -- |
Fees & Availability
| Fees | |
| Actual 12B-1 Fee | -- |
| Actual Management Fee | 1.21% |
| Administration Fee | 266.7K% |
| Maximum Front Load | -- |
| Maximum Deferred Load | -- |
| Maximum Redemption Fee | -- |
| General Availability | |
| Available for Insurance Product | No |
| Available for RRSP | No |
| Purchase Details | |
| Open to New Investors |
|
| Minimum Initial Investment | 5.00M None |
| Minimum Subsequent Investment | 0.00 None |
Basic Info
| Investment Strategy | |
| The Fund seeks current income, with a secondary objective to achieve long-term capital appreciation with moderate volatility and low to moderate correlation to the broader equity markets. The Fund invests at least 80% of its assets in fixed-income and fixed-income related securities, as described in this prospectus. |
| General | |
| Security Type | Unlisted Closed-End Fund |
| Equity Style | -- |
| Broad Asset Class | Taxable Bond |
| Broad Category | Fixed Income |
| Global Peer Group | Bond USD |
| Peer Group | General Bond Funds |
| Global Macro | Bond HC |
| US Macro | General Domestic Taxable Fixed Income Funds |
| YCharts Categorization | -- |
| YCharts Benchmark | -- |
| Prospectus Objective | General Bond Funds |
| Fund Owner Firm Name | Alternative Credit Income Fund |
| Broad Asset Class Benchmark Index | |
| ^BBUSATR | 100.0% |
Fundamentals
| General | |
| Distribution Yield | -- |
| Dividend Yield TTM (5-20-26) | 8.02% |
| 30-Day SEC Yield | -- |
| 7-Day SEC Yield | -- |
| Number of Holdings | 101 |
| Stock | |
| Weighted Average PE Ratio | -- |
| Weighted Average Price to Sales Ratio | -- |
| Weighted Average Price to Book Ratio | -- |
| Weighted Median ROE | -- |
| Weighted Median ROA | -- |
| ROI (TTM) | -- |
| Return on Investment (TTM) | -- |
| Earning Yield | -- |
| LT Debt / Shareholders Equity | -- |
| Number of Equity Holdings | 30 |
| Bond | |
| Yield to Maturity (2-28-26) | 10.00% |
| Effective Duration | -- |
| Average Coupon | 10.92% |
| Calculated Average Quality | 6.897 |
| Effective Maturity | 4.467 |
| Nominal Maturity | 4.467 |
| Number of Bond Holdings | 65 |
As of February 28, 2026
Growth Metrics
| EPS Growth (1Y) | -- |
| EPS Growth (3Y) | -- |
| EPS Growth (5Y) | -- |
| Sales Growth (1Y) | -- |
| Sales Growth (3Y) | -- |
| Sales Growth (5Y) | -- |
| Sales per Share Growth (1Y) | -- |
| Sales per Share Growth (3Y) | -- |
| Operating Cash Flow - Growth Rate (3Y) | -- |
As of February 28, 2026
Top Portfolio Holders
| Name | % Weight |
|---|---|
| Portfolio A | 5.00% |
| Portfolio B | 3.50% |
| Portfolio C | 2.25% |