

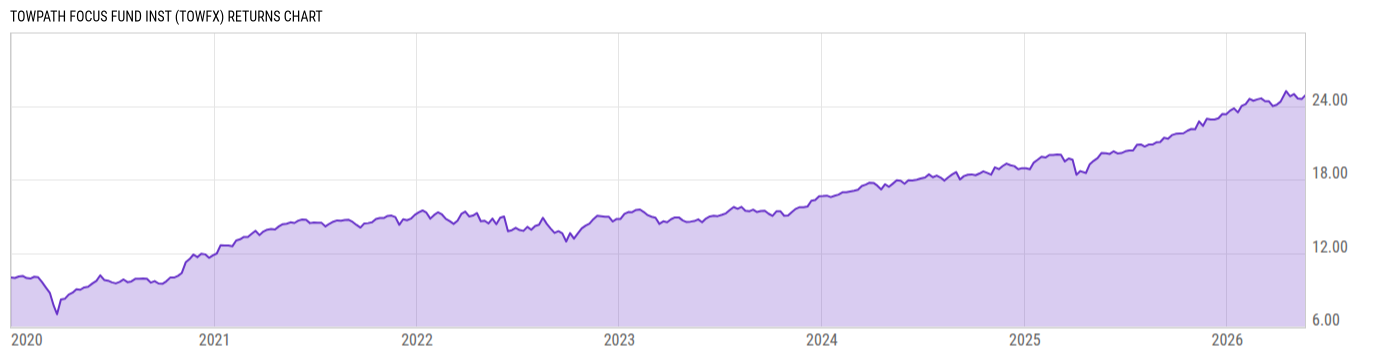
Towpath Focus Fund Inst (TOWFX)
20.37
+0.04
(+0.20%)
USD |
May 21 2026
Returns Chart
Key Stats
| Net Expense Ratio | Total Assets Under Management | Weighted Average Dividend Yield | Turnover Ratio (Generic) |
|---|---|---|---|
| 0.91% | 72.23M | 1.60% | 10.00% |
| 1 Year Fund Level Flows | 1 Year Total Returns (Daily) | Annualized Total Returns Since Inception (Daily) | Max Drawdown (Since Inception) |
| 10.63M | 24.49% |
Basic Info
| Investment Strategy | |
| The Fund seeks long-term capital appreciation. The Fund, under normal circumstances, will invest at least 80% of its assets in US equity securities but may also hold shares of foreign companies either directly or through American Depository Receipts and the Fund may also invest in companies of any capitalization size. |
| General | |
| Security Type | Mutual Fund |
| Equity Style | Multi Cap Core |
| Broad Asset Class | US Equity |
| Broad Category | Equity |
| Global Peer Group | Equity US |
| Peer Group | Multi-Cap Value Funds |
| Global Macro | Equity North America |
| US Macro | Multi-Cap Funds |
| YCharts Categorization | -- |
| YCharts Benchmark | -- |
| Prospectus Objective | Growth & Income Funds |
| Fund Owner Firm Name | Oelschlager Investment |
| Broad Asset Class Benchmark Index | |
| ^SPXTR | 100.0% |
Net Fund Flows Versus Peer Group
1 Month
% Rank:
17
-1.192B
Peer Group Low
650.74M
Peer Group High
1 Year
% Rank:
20
10.63M
-7.740B
Peer Group Low
7.542B
Peer Group High
3 Months
% Rank:
18
-2.423B
Peer Group Low
2.789B
Peer Group High
3 Years
% Rank:
18
-15.03B
Peer Group Low
11.11B
Peer Group High
6 Months
% Rank:
20
-6.212B
Peer Group Low
5.372B
Peer Group High
5 Years
% Rank:
20
-13.77B
Peer Group Low
35.39B
Peer Group High
YTD
% Rank:
21
-2.747B
Peer Group Low
2.785B
Peer Group High
10 Years
% Rank:
22
-31.74B
Peer Group Low
73.88B
Peer Group High
Date Unavailable
Risk
Performance Versus Peer Group
Annual Total Returns Versus Peers
As of May 22, 2026.
Asset Allocation
As of February 28, 2026.
| Type | % Net |
|---|---|
| Cash | 13.09% |
| Stock | 86.91% |
| Bond | 0.00% |
| Convertible | 0.00% |
| Preferred | 0.00% |
| Other | 0.00% |
Top 10 Holdings
| Name | % Weight | Price | % Change |
|---|---|---|---|
|
Cash and Cash Equivalents
|
13.09% | -- | -- |
| Alphabet, Inc. | 9.47% | 387.66 | -0.32% |
| McKesson Corp. | 6.25% | 766.50 | 1.57% |
| The Bank of New York Mellon Corp. | 6.16% | 138.98 | 1.33% |
| Shell Plc | 4.50% | 86.93 | 0.24% |
| Novartis AG | 4.39% | 151.76 | 0.87% |
| Tapestry, Inc. | 4.30% | 139.11 | 2.44% |
| Cencora, Inc. | 4.01% | 265.44 | 0.26% |
| Bank of America Corp. | 3.07% | 51.49 | 0.51% |
| GSK Plc | 2.91% | 51.53 | 1.48% |
Fees & Availability
| Fees | |
| Actual 12B-1 Fee | -- |
| Actual Management Fee | 0.70% |
| Administration Fee | 4.99K% |
| Maximum Front Load | -- |
| Maximum Deferred Load | -- |
| Maximum Redemption Fee | -- |
| General Availability | |
| Available for Insurance Product | No |
| Available for RRSP | No |
| Purchase Details | |
| Open to New Investors |
|
| Minimum Initial Investment | 2000.00 None |
| Minimum Subsequent Investment | 50.00 None |
Basic Info
| Investment Strategy | |
| The Fund seeks long-term capital appreciation. The Fund, under normal circumstances, will invest at least 80% of its assets in US equity securities but may also hold shares of foreign companies either directly or through American Depository Receipts and the Fund may also invest in companies of any capitalization size. |
| General | |
| Security Type | Mutual Fund |
| Equity Style | Multi Cap Core |
| Broad Asset Class | US Equity |
| Broad Category | Equity |
| Global Peer Group | Equity US |
| Peer Group | Multi-Cap Value Funds |
| Global Macro | Equity North America |
| US Macro | Multi-Cap Funds |
| YCharts Categorization | -- |
| YCharts Benchmark | -- |
| Prospectus Objective | Growth & Income Funds |
| Fund Owner Firm Name | Oelschlager Investment |
| Broad Asset Class Benchmark Index | |
| ^SPXTR | 100.0% |
Fundamentals
| General | |
| Distribution Yield | -- |
| Dividend Yield TTM (5-20-26) | 1.02% |
| 30-Day SEC Yield | -- |
| 7-Day SEC Yield | -- |
| Number of Holdings | 36 |
| Stock | |
| Weighted Average PE Ratio | 27.25 |
| Weighted Average Price to Sales Ratio | 4.361 |
| Weighted Average Price to Book Ratio | 8.045 |
| Weighted Median ROE | 35.16% |
| Weighted Median ROA | 9.64% |
| ROI (TTM) | 17.02% |
| Return on Investment (TTM) | 17.02% |
| Earning Yield | 0.0440 |
| LT Debt / Shareholders Equity | 1.183 |
| Number of Equity Holdings | 35 |
As of February 28, 2026
Growth Metrics
| EPS Growth (1Y) | 26.33% |
| EPS Growth (3Y) | 15.95% |
| EPS Growth (5Y) | 21.42% |
| Sales Growth (1Y) | 6.55% |
| Sales Growth (3Y) | 5.65% |
| Sales Growth (5Y) | 8.91% |
| Sales per Share Growth (1Y) | 9.29% |
| Sales per Share Growth (3Y) | 8.95% |
| Operating Cash Flow - Growth Rate (3Y) | 8.13% |
As of February 28, 2026
Fund Details
| Key Dates | |
| Inception Date | 12/31/2019 |
| Last Annual Report Date | 11/30/2025 |
| Last Prospectus Date | 3/31/2025 |
| Attributes | |
| Index Fund | -- |
| Inverse Fund | No |
| Leveraged Fund | -- |
| Fund of Funds | No |
| Currency Hedged Fund | -- |
| Socially Responsible Fund | No |
Top Portfolio Holders
| Name | % Weight |
|---|---|
| Portfolio A | 5.00% |
| Portfolio B | 3.50% |
| Portfolio C | 2.25% |
Excel Add-In Codes
| Name: =YCI("M:TOWFX", "name") |
| Broad Asset Class: =YCI("M:TOWFX", "broad_asset_class") |
| Broad Category: =YCI("M:TOWFX", "broad_category_group") |
| Prospectus Objective: =YCI("M:TOWFX", "prospectus_objective") |
| To find the codes for any of our securities and financial metrics, see our Complete Excel Reference. |