

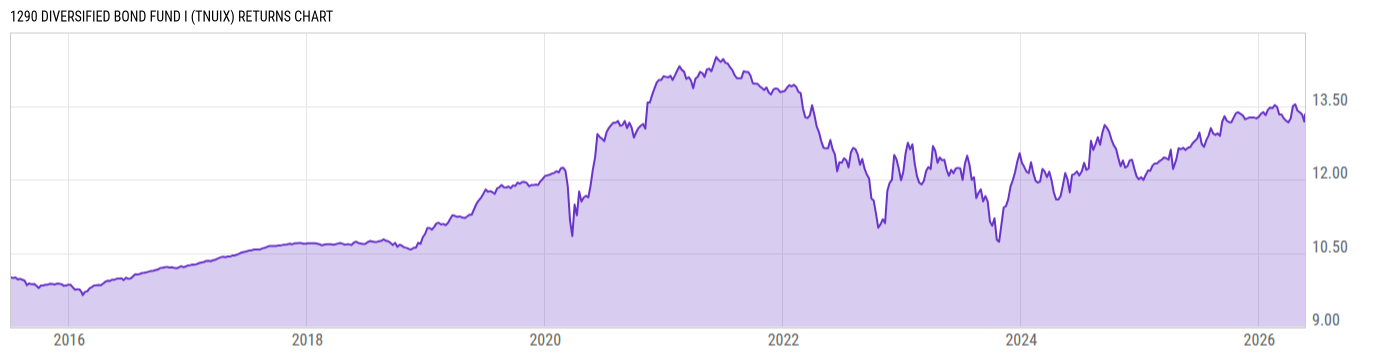
1290 Diversified Bond Fund I (TNUIX)
8.42
+0.02
(+0.24%)
USD |
Jun 09 2026
Returns Chart
Key Stats
| Net Expense Ratio | Total Assets Under Management | Weighted Average Dividend Yield | Turnover Ratio (Generic) |
|---|---|---|---|
| 0.50% | 595.99M | -- | 208.0% |
| 1 Year Fund Level Flows | 1 Year Total Returns (Daily) | Annualized Total Returns Since Inception (Daily) | Max Drawdown (Since Inception) |
| 5.423M | 5.76% |
Basic Info
| Investment Strategy | |
| The Fund seeks to achieve maximum current income and total return over a full market cycle through opportunistic sector allocation. Under normal circumstances, the Fund will invest at least 80% of its net assets in a diversified portfolio of U.S. and foreign bonds or other debt securities of varying maturities. |
| General | |
| Security Type | Mutual Fund |
| Equity Style | -- |
| Broad Asset Class | Taxable Bond |
| Broad Category | Fixed Income |
| Global Peer Group | Bond Global USD |
| Peer Group | Global Income Funds |
| Global Macro | Bond Global |
| US Macro | World Income Funds |
| YCharts Categorization | -- |
| YCharts Benchmark | -- |
| Prospectus Objective | Global Income Funds |
| Fund Owner Firm Name | 1290 Funds |
| Broad Asset Class Benchmark Index | |
| ^BBUSATR | 100.0% |
Net Fund Flows Versus Peer Group
1 Month
% Rank:
35
-35.14M
Peer Group Low
294.12M
Peer Group High
1 Year
% Rank:
44
5.423M
-1.119B
Peer Group Low
1.537B
Peer Group High
3 Months
% Rank:
20
-325.40M
Peer Group Low
571.67M
Peer Group High
3 Years
% Rank:
56
-2.484B
Peer Group Low
2.741B
Peer Group High
6 Months
% Rank:
33
-731.75M
Peer Group Low
783.93M
Peer Group High
5 Years
% Rank:
21
-7.808B
Peer Group Low
3.313B
Peer Group High
YTD
% Rank:
31
-469.47M
Peer Group Low
717.27M
Peer Group High
10 Years
% Rank:
21
-47.03B
Peer Group Low
4.548B
Peer Group High
Date Unavailable
Risk
Performance Versus Peer Group
Annual Total Returns Versus Peers
As of June 10, 2026.
Asset Allocation
As of March 31, 2026.
| Type | % Net |
|---|---|
| Cash | 3.81% |
| Stock | 0.00% |
| Bond | 95.62% |
| Convertible | 0.00% |
| Preferred | 0.00% |
| Other | 0.57% |
Top 10 Holdings
| Name | % Weight | Price | % Change |
|---|---|---|---|
|
LONG GILT JUN6
|
20.80% | -- | -- |
|
10YR TB-DAY JUN6
|
16.39% | -- | -- |
| United States of America USGB 4.25 08/15/2035 FIX USD Government | 10.22% | 97.98 | -0.12% |
| United States of America USGB 01/31/2028 FLT USD Government | 7.31% | 100.19 | 0.01% |
| United States of America USGB 4.75 05/15/2055 FIX USD Government | 7.29% | 95.59 | -0.30% |
| JPMorgan Prime Money Market Fund IM | 5.79% | 1.000 | 0.00% |
|
Colombia, Republic of (Government) 11.5% 25-JUL-2046
|
4.79% | -- | -- |
| United States of America USGB 2.375 02/15/2056 FIX USD Government | 4.77% | 91.76 | -0.51% |
|
Brazil, Federative Republic of (Government) 10% 01-JAN-2035
|
4.31% | -- | -- |
|
Australia, Commonwealth of (Government) 4.25% 21-OCT-2036
|
4.20% | -- | -- |
Fees & Availability
| Fees | |
| Actual 12B-1 Fee | -- |
| Actual Management Fee | 0.21% |
| Administration Fee | 880.7K% |
| Maximum Front Load | -- |
| Maximum Deferred Load | -- |
| Maximum Redemption Fee | -- |
| General Availability | |
| Available for Insurance Product | No |
| Available for RRSP | No |
| Purchase Details | |
| Open to New Investors |
|
| Minimum Initial Investment | 1.00M None |
| Minimum Subsequent Investment | 0.00 None |
Basic Info
| Investment Strategy | |
| The Fund seeks to achieve maximum current income and total return over a full market cycle through opportunistic sector allocation. Under normal circumstances, the Fund will invest at least 80% of its net assets in a diversified portfolio of U.S. and foreign bonds or other debt securities of varying maturities. |
| General | |
| Security Type | Mutual Fund |
| Equity Style | -- |
| Broad Asset Class | Taxable Bond |
| Broad Category | Fixed Income |
| Global Peer Group | Bond Global USD |
| Peer Group | Global Income Funds |
| Global Macro | Bond Global |
| US Macro | World Income Funds |
| YCharts Categorization | -- |
| YCharts Benchmark | -- |
| Prospectus Objective | Global Income Funds |
| Fund Owner Firm Name | 1290 Funds |
| Broad Asset Class Benchmark Index | |
| ^BBUSATR | 100.0% |
Fundamentals
| General | |
| Distribution Yield | -- |
| Dividend Yield TTM (6-8-26) | 3.32% |
| 30-Day SEC Yield (5-31-26) | 7.32% |
| 7-Day SEC Yield | -- |
| Number of Holdings | 66 |
| Bond | |
| Yield to Maturity (3-31-26) | 6.29% |
| Effective Duration | 4.27 |
| Average Coupon | 6.20% |
| Calculated Average Quality | 3.059 |
| Effective Maturity | 15.40 |
| Nominal Maturity | 15.61 |
| Number of Bond Holdings | 56 |
As of March 31, 2026
Fund Details
Top Portfolio Holders
| Name | % Weight |
|---|---|
| Portfolio A | 5.00% |
| Portfolio B | 3.50% |
| Portfolio C | 2.25% |
Excel Add-In Codes
| Name: =YCI("M:TNUIX", "name") |
| Broad Asset Class: =YCI("M:TNUIX", "broad_asset_class") |
| Broad Category: =YCI("M:TNUIX", "broad_category_group") |
| Prospectus Objective: =YCI("M:TNUIX", "prospectus_objective") |
| To find the codes for any of our securities and financial metrics, see our Complete Excel Reference. |