

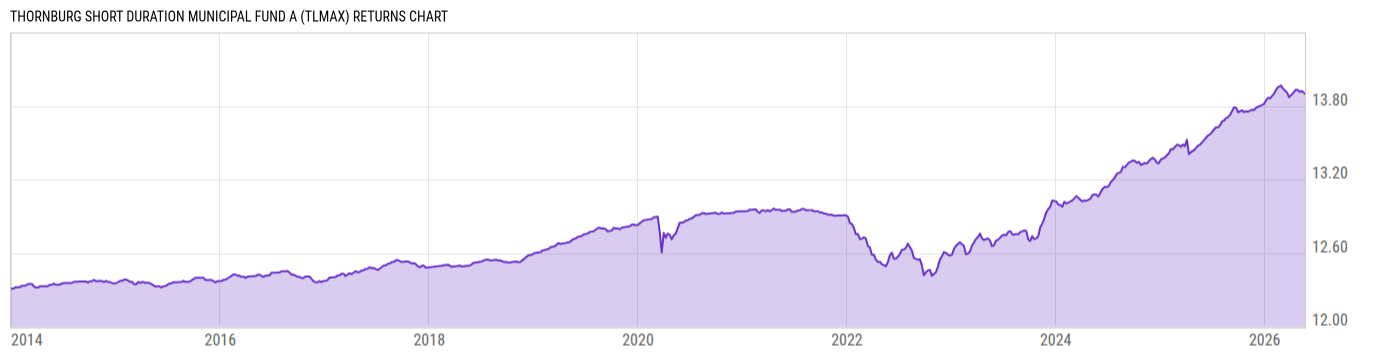
Thornburg Short Duration Municipal Fund A (TLMAX)
11.87
0.00 (0.00%)
USD |
May 22 2026
Returns Chart
Key Stats
| Net Expense Ratio | Total Assets Under Management | Weighted Average Dividend Yield | Turnover Ratio (Generic) |
|---|---|---|---|
| 0.70% | 90.19M | -- | 55.00% |
| 1 Year Fund Level Flows | 1 Year Total Returns (Daily) | Annualized Total Returns Since Inception (Daily) | Max Drawdown (Since Inception) |
| -26.74M | 3.06% |
Basic Info
| Investment Strategy | |
| The Fund seeks current income exempt from federal income tax, consistent with preservation of capital. The Fund invests principally in a laddered maturity portfolio of municipal obligations issued by states and state agencies, local governments and their agencies and by certain United States territories and possessions. |
| General | |
| Security Type | Mutual Fund |
| Equity Style | -- |
| Broad Asset Class | Municipal Bond |
| Broad Category | Fixed Income |
| Global Peer Group | Bond USD Municipal Short Term |
| Peer Group | Short Municipal Debt Funds |
| Global Macro | -- |
| US Macro | National Municipal Debt Funds |
| YCharts Categorization | -- |
| YCharts Benchmark | -- |
| Prospectus Objective | Short Municipal Debt Funds |
| Fund Owner Firm Name | Thornburg |
| Broad Asset Class Benchmark Index | |
| ^BBMBTR | 100.0% |
Net Fund Flows Versus Peer Group
1 Month
% Rank:
54
-163.19M
Peer Group Low
105.80M
Peer Group High
1 Year
% Rank:
84
-26.74M
-452.89M
Peer Group Low
2.569B
Peer Group High
3 Months
% Rank:
75
-236.38M
Peer Group Low
641.38M
Peer Group High
3 Years
% Rank:
53
-2.025B
Peer Group Low
3.410B
Peer Group High
6 Months
% Rank:
78
-296.14M
Peer Group Low
947.01M
Peer Group High
5 Years
% Rank:
38
-7.012B
Peer Group Low
4.135B
Peer Group High
YTD
% Rank:
79
-240.69M
Peer Group Low
641.38M
Peer Group High
10 Years
% Rank:
47
-4.632B
Peer Group Low
5.923B
Peer Group High
Date Unavailable
Risk
Performance Versus Peer Group
Annual Total Returns Versus Peers
As of May 24, 2026.
Asset Allocation
As of February 28, 2026.
| Type | % Net |
|---|---|
| Cash | -0.01% |
| Stock | 0.00% |
| Bond | 98.16% |
| Convertible | 0.00% |
| Preferred | 0.00% |
| Other | 1.85% |
Top 10 Holdings
| Name | % Weight | Price | % Change |
|---|---|---|---|
| PEFA INC IOWA GAS PROJ REV IA 5.000 09/01/2049 | 3.21% | 100.83 | 0.00% |
| KENTUCKY INC KY PUB ENERGY AUTH GAS SUPPLY REV KY 5.250 06/01/2055 | 2.57% | 105.27 | 0.05% |
|
Other Assets less Liabilities
|
2.44% | -- | -- |
| TENNERGY CORP TENN GAS REV TN 5.000 10/01/2054 | 2.28% | 105.59 | 0.06% |
| LOS ANGELES CALIF DEPT ARPTS ARPT REV CA 5.000 05/15/2030 | 2.28% | 107.20 | 0.06% |
| TRAVIS CNTY TEX HSG FIN CORP MULTIFAMILY HSG REV TX 4.125 06/01/2045 | 2.26% | 100.05 | 0.00% |
| HARRIS CNTY TEX CULTURAL ED FACS FIN CORP REV TX 5.000 05/15/2027 | 2.18% | 101.90 | -0.00% |
| CALIFORNIA CMNTY CHOICE FING AUTH CLEAN ENERGY PROJ REV CA 5.000 04/01/2031 | 1.97% | 103.17 | 0.08% |
| HALIFAX CNTY VA INDL DEV AUTH REV VA 3.800 12/01/2041 | 1.75% | 100.92 | 0.01% |
| METROPOLITAN TRANSN AUTH N Y REV NY 2.000 11/15/2050 | 1.68% | 100.00 | 0.00% |
Fees & Availability
| Fees | |
| Actual 12B-1 Fee | 0.20% |
| Actual Management Fee | 0.04% |
| Administration Fee | 4.83K% |
| Maximum Front Load | 2.25% |
| Maximum Deferred Load | -- |
| Maximum Redemption Fee | -- |
| General Availability | |
| Available for Insurance Product | No |
| Available for RRSP | No |
| Purchase Details | |
| Open to New Investors |
|
| Minimum Initial Investment | 5000.00 None |
| Minimum Subsequent Investment | 100.00 None |
Basic Info
| Investment Strategy | |
| The Fund seeks current income exempt from federal income tax, consistent with preservation of capital. The Fund invests principally in a laddered maturity portfolio of municipal obligations issued by states and state agencies, local governments and their agencies and by certain United States territories and possessions. |
| General | |
| Security Type | Mutual Fund |
| Equity Style | -- |
| Broad Asset Class | Municipal Bond |
| Broad Category | Fixed Income |
| Global Peer Group | Bond USD Municipal Short Term |
| Peer Group | Short Municipal Debt Funds |
| Global Macro | -- |
| US Macro | National Municipal Debt Funds |
| YCharts Categorization | -- |
| YCharts Benchmark | -- |
| Prospectus Objective | Short Municipal Debt Funds |
| Fund Owner Firm Name | Thornburg |
| Broad Asset Class Benchmark Index | |
| ^BBMBTR | 100.0% |
Fundamentals
| General | |
| Distribution Yield | -- |
| Dividend Yield TTM (5-21-26) | 3.05% |
| 30-Day SEC Yield (3-31-26) | 2.53% |
| 7-Day SEC Yield | -- |
| Number of Holdings | 109 |
| Bond | |
| Yield to Maturity (2-28-26) | 2.85% |
| Effective Duration | -- |
| Average Coupon | 4.39% |
| Calculated Average Quality | 2.737 |
| Effective Maturity | 11.90 |
| Nominal Maturity | 13.12 |
| Number of Bond Holdings | 103 |
As of February 28, 2026
Fund Details
| Key Dates | |
| Inception Date | 12/30/2013 |
| Last Annual Report Date | 9/30/2025 |
| Last Prospectus Date | 2/1/2026 |
| Share Classes | |
| TLMIX | Inst |
| Attributes | |
| Index Fund | -- |
| Inverse Fund | No |
| Leveraged Fund | -- |
| Fund of Funds | No |
| Currency Hedged Fund | -- |
| Socially Responsible Fund | No |
Top Portfolio Holders
| Name | % Weight |
|---|---|
| Portfolio A | 5.00% |
| Portfolio B | 3.50% |
| Portfolio C | 2.25% |
Excel Add-In Codes
| Name: =YCI("M:TLMAX", "name") |
| Broad Asset Class: =YCI("M:TLMAX", "broad_asset_class") |
| Broad Category: =YCI("M:TLMAX", "broad_category_group") |
| Prospectus Objective: =YCI("M:TLMAX", "prospectus_objective") |
| To find the codes for any of our securities and financial metrics, see our Complete Excel Reference. |