

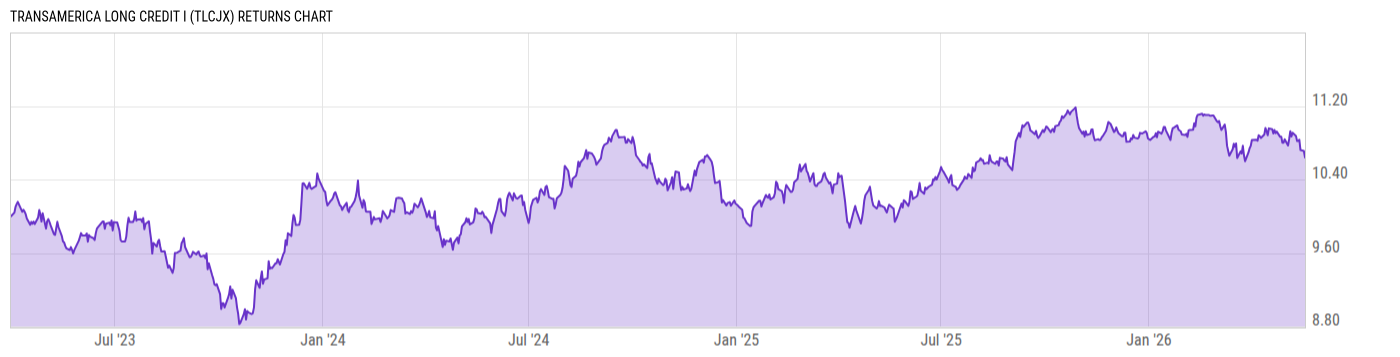
Transamerica Long Credit I (TLCJX)
9.27
+0.03
(+0.32%)
USD |
Jun 09 2026
Returns Chart
Key Stats
| Net Expense Ratio | Total Assets Under Management | Weighted Average Dividend Yield | Turnover Ratio (Generic) |
|---|---|---|---|
| 0.65% | 158.57M | -- | 42.00% |
| 1 Year Fund Level Flows | 1 Year Total Returns (Daily) | Annualized Total Returns Since Inception (Daily) | Max Drawdown (Since Inception) |
| -436.17M | 6.68% |
Basic Info
| Investment Strategy | |
| The Fund seeks to provide total return through a combination of current income and capital appreciation. Under normal circumstances, the fund will invest at least 80% of its net assets in fixed-income securities with dollar-weighted average credit rating of investment grade and duration of more than 10 years. |
| General | |
| Security Type | Mutual Fund |
| Equity Style | -- |
| Broad Asset Class | Taxable Bond |
| Broad Category | Fixed Income |
| Global Peer Group | Bond USD Corporates |
| Peer Group | Corporate Debt Funds BBB-Rated |
| Global Macro | Bond Corporates |
| US Macro | General Domestic Taxable Fixed Income Funds |
| YCharts Categorization | -- |
| YCharts Benchmark | -- |
| Prospectus Objective | Corporate Debt Funds BBB-Rated |
| Fund Owner Firm Name | Transamerica |
| Broad Asset Class Benchmark Index | |
| ^BBUSATR | 100.0% |
Net Fund Flows Versus Peer Group
1 Month
% Rank:
45
-1.441B
Peer Group Low
748.99M
Peer Group High
1 Year
% Rank:
96
-436.17M
-3.244B
Peer Group Low
12.80B
Peer Group High
3 Months
% Rank:
40
-1.908B
Peer Group Low
1.681B
Peer Group High
3 Years
% Rank:
32
-9.856B
Peer Group Low
25.39B
Peer Group High
6 Months
% Rank:
99
-3.368B
Peer Group Low
8.887B
Peer Group High
5 Years
% Rank:
29
-10.18B
Peer Group Low
26.92B
Peer Group High
YTD
% Rank:
46
-471.58M
Peer Group Low
7.655B
Peer Group High
10 Years
% Rank:
53
-8.640B
Peer Group Low
62.93B
Peer Group High
Date Unavailable
Risk
Performance Versus Peer Group
Annual Total Returns Versus Peers
As of June 10, 2026.
Asset Allocation
As of April 30, 2026.
| Type | % Net |
|---|---|
| Cash | 1.15% |
| Stock | 0.00% |
| Bond | 95.66% |
| Convertible | 0.00% |
| Preferred | 0.00% |
| Other | 3.19% |
Top 10 Holdings
| Name | % Weight | Price | % Change |
|---|---|---|---|
|
J.G. WENTWORTH LLC 191 A FIX 3.82% 17-AUG-2071
|
1.72% | -- | -- |
| United States of America USGB 4.625 11/15/2045 FIX USD Government | 1.44% | 94.81 | -0.27% |
| Charter Communications Operating, LLC CHTR-Operating 6.484 10/23/2045 FIX USD Corporate | 1.18% | 91.83 | -0.15% |
|
Fixed Income Clearing Corp Repo
|
1.15% | -- | -- |
| JPMorgan Chase & Co. JPM 3.109 04/22/2041 FLT USD Corporate '40 | 1.05% | 76.32 | -0.41% |
| United States of America USGB 1.5 02/15/2053 FIX USD Government | 0.99% | 75.68 | -0.51% |
| United States of America USGB 1.25 05/15/2050 FIX USD Government | 0.97% | 46.73 | -0.41% |
| Oracle Corporation ORCLE 6.9 11/09/2052 FIX USD Corporate | 0.97% | 96.27 | -0.16% |
| Bank of America Corporation BACORP 5.045 02/06/2037 FLT USD Corporate '36 | 0.97% | 97.73 | -0.13% |
| Virginia Electric and Power Company D-VirgEl+Pwr 8.875 11/15/2038 FIX USD Corporate | 0.97% | 129.83 | -0.07% |
Fees & Availability
| Fees | |
| Actual 12B-1 Fee | -- |
| Actual Management Fee | 0.41% |
| Administration Fee | -- |
| Maximum Front Load | -- |
| Maximum Deferred Load | -- |
| Maximum Redemption Fee | -- |
| General Availability | |
| Available for Insurance Product | No |
| Available for RRSP | No |
| Purchase Details | |
| Open to New Investors |
|
| Minimum Initial Investment | 1.00M None |
| Minimum Subsequent Investment | 0.00 None |
Basic Info
| Investment Strategy | |
| The Fund seeks to provide total return through a combination of current income and capital appreciation. Under normal circumstances, the fund will invest at least 80% of its net assets in fixed-income securities with dollar-weighted average credit rating of investment grade and duration of more than 10 years. |
| General | |
| Security Type | Mutual Fund |
| Equity Style | -- |
| Broad Asset Class | Taxable Bond |
| Broad Category | Fixed Income |
| Global Peer Group | Bond USD Corporates |
| Peer Group | Corporate Debt Funds BBB-Rated |
| Global Macro | Bond Corporates |
| US Macro | General Domestic Taxable Fixed Income Funds |
| YCharts Categorization | -- |
| YCharts Benchmark | -- |
| Prospectus Objective | Corporate Debt Funds BBB-Rated |
| Fund Owner Firm Name | Transamerica |
| Broad Asset Class Benchmark Index | |
| ^BBUSATR | 100.0% |
Fundamentals
| General | |
| Distribution Yield | -- |
| Dividend Yield TTM (6-8-26) | 5.15% |
| 30-Day SEC Yield (5-31-26) | 5.37% |
| 7-Day SEC Yield | -- |
| Number of Holdings | 283 |
| Bond | |
| Yield to Maturity (4-30-26) | 5.91% |
| Effective Duration | -- |
| Average Coupon | 5.20% |
| Calculated Average Quality | 3.484 |
| Effective Maturity | 23.79 |
| Nominal Maturity | 23.95 |
| Number of Bond Holdings | 271 |
As of April 30, 2026
Fund Details
| Key Dates | |
| Inception Date | 3/31/2023 |
| Last Annual Report Date | 10/31/2025 |
| Last Prospectus Date | 3/1/2026 |
| Share Classes | |
| LP40300488 | I2 |
| TLCDX | A |
| Attributes | |
| Index Fund | -- |
| Inverse Fund | No |
| Leveraged Fund | -- |
| Fund of Funds | No |
| Currency Hedged Fund | -- |
| Socially Responsible Fund | No |
Top Portfolio Holders
| Name | % Weight |
|---|---|
| Portfolio A | 5.00% |
| Portfolio B | 3.50% |
| Portfolio C | 2.25% |
Excel Add-In Codes
| Name: =YCI("M:TLCJX", "name") |
| Broad Asset Class: =YCI("M:TLCJX", "broad_asset_class") |
| Broad Category: =YCI("M:TLCJX", "broad_category_group") |
| Prospectus Objective: =YCI("M:TLCJX", "prospectus_objective") |
| To find the codes for any of our securities and financial metrics, see our Complete Excel Reference. |