

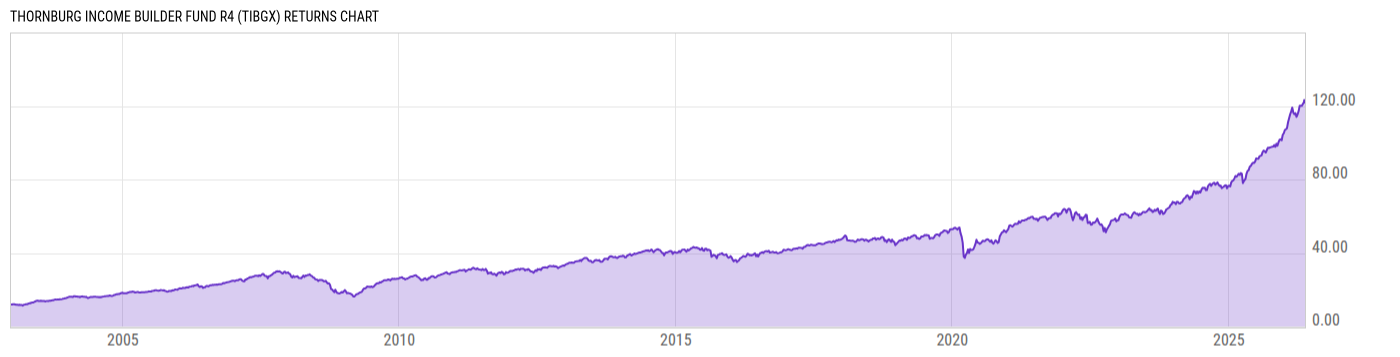
Thornburg Income Builder Fund R4 (TIBGX)
37.87
+0.20
(+0.53%)
USD |
Jun 09 2026
Returns Chart
Key Stats
| Net Expense Ratio | Total Assets Under Management | Weighted Average Dividend Yield | Turnover Ratio (Generic) |
|---|---|---|---|
| 1.27% | 22.46B | 3.47% | 28.00% |
| 1 Year Fund Level Flows | 1 Year Total Returns (Daily) | Annualized Total Returns Since Inception (Daily) | Max Drawdown (Since Inception) |
| 775.82M | 37.39% |
Basic Info
| Investment Strategy | |
| The Fund seeks primarily to provide a level of current income which exceeds the average yield on US stocks, and secondarily, seeks long-term capital appreciation. The Fund invests, under normal conditions, at least 80% of its assets in income-producing securities, and at least 50% of its assets in common stocks. |
| General | |
| Security Type | Mutual Fund |
| Equity Style | Large Cap Value |
| Broad Asset Class | International Equity |
| Broad Category | Equity |
| Global Peer Group | Equity Global Income |
| Peer Group | Global Equity Income Funds |
| Global Macro | Equity Global |
| US Macro | Developed Global Markets Funds |
| YCharts Categorization | -- |
| YCharts Benchmark | -- |
| Prospectus Objective | Global Funds |
| Fund Owner Firm Name | Thornburg |
| Broad Asset Class Benchmark Index | |
| ^MSACXUSNTR | 100.0% |
Net Fund Flows Versus Peer Group
1 Month
% Rank:
7
-382.05M
Peer Group Low
2.871B
Peer Group High
1 Year
% Rank:
6
775.82M
-5.337B
Peer Group Low
2.871B
Peer Group High
3 Months
% Rank:
7
-938.28M
Peer Group Low
2.871B
Peer Group High
3 Years
% Rank:
7
-20.01B
Peer Group Low
4.253B
Peer Group High
6 Months
% Rank:
6
-3.422B
Peer Group Low
2.871B
Peer Group High
5 Years
% Rank:
17
-27.17B
Peer Group Low
4.253B
Peer Group High
YTD
% Rank:
7
-1.912B
Peer Group Low
2.871B
Peer Group High
10 Years
% Rank:
79
-54.86B
Peer Group Low
4.253B
Peer Group High
Date Unavailable
Risk
Performance Versus Peer Group
Annual Total Returns Versus Peers
As of June 10, 2026.
Asset Allocation
As of March 31, 2026.
| Type | % Net |
|---|---|
| Cash | 0.01% |
| Stock | 87.41% |
| Bond | 6.51% |
| Convertible | 0.00% |
| Preferred | 0.16% |
| Other | 5.90% |
Top 10 Holdings
| Name | % Weight | Price | % Change |
|---|---|---|---|
| Orange SA | 7.01% | 19.85 | -4.36% |
|
THORNBURG CAPITAL MANAGEMENT FUND
|
5.75% | -- | -- |
| Taiwan Semiconductor Manufacturing Co., Ltd. | 4.84% | 17.24 | 0.00% |
| Citigroup, Inc. | 3.76% | 135.28 | 0.41% |
| AT&T, Inc. | 3.71% | 22.85 | 0.62% |
| TotalEnergies SE | 3.60% | 88.94 | 0.53% |
| BNP Paribas SA | 3.56% | 107.30 | -0.21% |
| NN Group NV | 3.55% | 88.57 | 0.00% |
| Samsung Electronics Co., Ltd. | 3.07% | 140.00 | 0.00% |
| Broadcom Inc. | 2.98% | 374.16 | -4.59% |
Fees & Availability
| Fees | |
| Actual 12B-1 Fee | 0.25% |
| Actual Management Fee | 0.54% |
| Administration Fee | 10.98K% |
| Maximum Front Load | -- |
| Maximum Deferred Load | -- |
| Maximum Redemption Fee | -- |
| General Availability | |
| Available for Insurance Product | No |
| Available for RRSP | No |
| Purchase Details | |
| Open to New Investors | No |
| Minimum Initial Investment | 0.00 None |
| Minimum Subsequent Investment | 0.00 None |
Basic Info
| Investment Strategy | |
| The Fund seeks primarily to provide a level of current income which exceeds the average yield on US stocks, and secondarily, seeks long-term capital appreciation. The Fund invests, under normal conditions, at least 80% of its assets in income-producing securities, and at least 50% of its assets in common stocks. |
| General | |
| Security Type | Mutual Fund |
| Equity Style | Large Cap Value |
| Broad Asset Class | International Equity |
| Broad Category | Equity |
| Global Peer Group | Equity Global Income |
| Peer Group | Global Equity Income Funds |
| Global Macro | Equity Global |
| US Macro | Developed Global Markets Funds |
| YCharts Categorization | -- |
| YCharts Benchmark | -- |
| Prospectus Objective | Global Funds |
| Fund Owner Firm Name | Thornburg |
| Broad Asset Class Benchmark Index | |
| ^MSACXUSNTR | 100.0% |
Fundamentals
| General | |
| Distribution Yield | -- |
| Dividend Yield TTM (6-8-26) | 3.99% |
| 30-Day SEC Yield (4-30-26) | 1.90% |
| 7-Day SEC Yield | -- |
| Number of Holdings | 331 |
| Stock | |
| Weighted Average PE Ratio | 24.90 |
| Weighted Average Price to Sales Ratio | 3.531 |
| Weighted Average Price to Book Ratio | 4.235 |
| Weighted Median ROE | 49.90% |
| Weighted Median ROA | 5.68% |
| ROI (TTM) | 8.51% |
| Return on Investment (TTM) | 8.51% |
| Earning Yield | 0.0548 |
| LT Debt / Shareholders Equity | 0.9725 |
| Number of Equity Holdings | 66 |
| Bond | |
| Yield to Maturity (3-31-26) | -- |
| Effective Duration | -- |
| Average Coupon | -- |
| Calculated Average Quality | -- |
| Effective Maturity | -- |
| Nominal Maturity | -- |
| Number of Bond Holdings | 255 |
As of March 31, 2026
Growth Metrics
| EPS Growth (1Y) | 5.97% |
| EPS Growth (3Y) | 4.23% |
| EPS Growth (5Y) | 9.14% |
| Sales Growth (1Y) | 6.07% |
| Sales Growth (3Y) | 2.41% |
| Sales Growth (5Y) | 5.28% |
| Sales per Share Growth (1Y) | 7.36% |
| Sales per Share Growth (3Y) | -1.12% |
| Operating Cash Flow - Growth Rate (3Y) | 4.66% |
As of March 31, 2026
Fund Details
| Key Dates | |
| Inception Date | 12/24/2002 |
| Last Annual Report Date | 9/30/2025 |
| Last Prospectus Date | 2/1/2026 |
| Share Classes | |
| TIBAX | A |
| TIBCX | C |
| TIBIX | Inst |
| TIBMX | Retirement |
| TIBOX | Retirement |
| TIBRX | Retirement |
| Attributes | |
| Index Fund | -- |
| Inverse Fund | No |
| Leveraged Fund | -- |
| Fund of Funds | No |
| Currency Hedged Fund | -- |
| Socially Responsible Fund | No |
Top Portfolio Holders
| Name | % Weight |
|---|---|
| Portfolio A | 5.00% |
| Portfolio B | 3.50% |
| Portfolio C | 2.25% |
Excel Add-In Codes
| Name: =YCI("M:TIBGX", "name") |
| Broad Asset Class: =YCI("M:TIBGX", "broad_asset_class") |
| Broad Category: =YCI("M:TIBGX", "broad_category_group") |
| Prospectus Objective: =YCI("M:TIBGX", "prospectus_objective") |
| To find the codes for any of our securities and financial metrics, see our Complete Excel Reference. |