

Thornburg New Mexico Intermediate Municipal Fund A (THNMX)
12.38
+0.01
(+0.08%)
USD |
May 27 2026
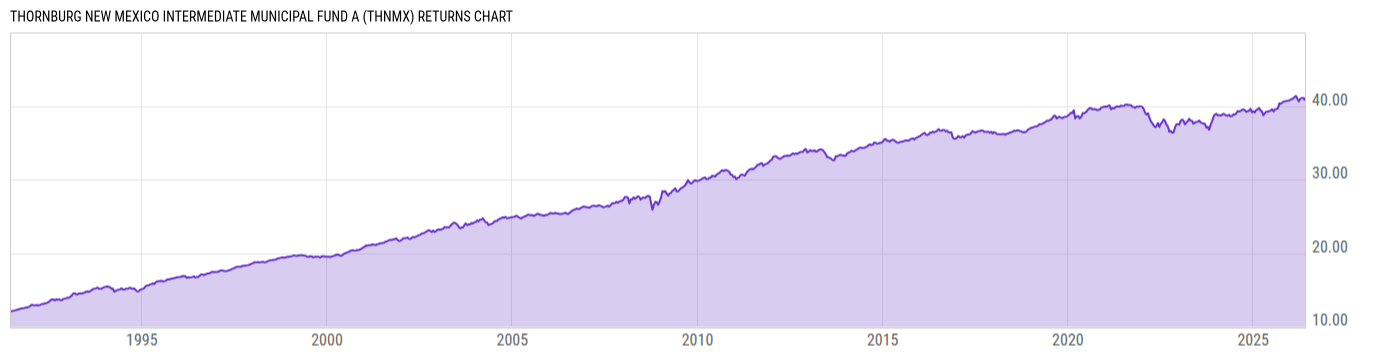
Returns Chart
Key Stats
| Net Expense Ratio | Total Assets Under Management | Weighted Average Dividend Yield | Turnover Ratio (Generic) |
|---|---|---|---|
| 0.92% | 84.39M | -- | 32.00% |
| 1 Year Fund Level Flows | 1 Year Total Returns (Daily) | Annualized Total Returns Since Inception (Daily) | Max Drawdown (Since Inception) |
| -2.128M | 4.52% |
Basic Info
| Investment Strategy | |
| The Fund seeks to obtain as high a level of current income exempts from federal and New Mexico state individual income taxes. The Fund invests in a laddered maturity portfolio of municipal obligations issued by the State of New Mexico and its agencies, and by New Mexico local governments and their agencies. |
| General | |
| Security Type | Mutual Fund |
| Equity Style | -- |
| Broad Asset Class | Municipal Bond |
| Broad Category | Fixed Income |
| Global Peer Group | Bond USD Municipal |
| Peer Group | Other States Intermediate Muni Debt Fds |
| Global Macro | Bond HC |
| US Macro | Single State Municipal Debt Funds |
| YCharts Categorization | -- |
| YCharts Benchmark | -- |
| Prospectus Objective | Other States Intermediate Muni Debt Fds |
| Fund Owner Firm Name | Thornburg |
| Broad Asset Class Benchmark Index | |
| ^BBMBTR | 100.0% |
Net Fund Flows Versus Peer Group
1 Month
% Rank:
74
-2.813M
Peer Group Low
6.923M
Peer Group High
1 Year
% Rank:
39
-2.128M
-20.96M
Peer Group Low
62.92M
Peer Group High
3 Months
% Rank:
62
-13.42M
Peer Group Low
18.18M
Peer Group High
3 Years
% Rank:
60
-130.91M
Peer Group Low
33.14M
Peer Group High
6 Months
% Rank:
67
-16.57M
Peer Group Low
27.53M
Peer Group High
5 Years
% Rank:
77
-205.98M
Peer Group Low
-8.630M
Peer Group High
YTD
% Rank:
70
-11.62M
Peer Group Low
20.78M
Peer Group High
10 Years
% Rank:
74
-228.81M
Peer Group Low
94.61M
Peer Group High
Date Unavailable
Risk
Performance Versus Peer Group
Annual Total Returns Versus Peers
As of May 28, 2026.
Asset Allocation
As of March 31, 2026.
| Type | % Net |
|---|---|
| Cash | 2.44% |
| Stock | 0.00% |
| Bond | 97.14% |
| Convertible | 0.00% |
| Preferred | 0.00% |
| Other | 0.43% |
Top 10 Holdings
| Name | % Weight | Price | % Change |
|---|---|---|---|
| NEW MEXICO FIN AUTH REV NM 4.000 06/01/2034 | 4.33% | 100.05 | 0.00% |
| NEW MEXICO MUN ENERGY ACQUISITION AUTH GAS SUPPLY REV NM 5.000 06/01/2054 | 3.33% | 105.82 | 0.11% |
| NEW MEXICO ST HOSP EQUIP LN COUNCIL HOSP REV NM 4.000 08/01/2037 | 3.15% | 97.81 | 0.18% |
| LOS RANCHOS DE ALBUQUERQUE NEW MEXICO EDL FACS REV NM 4.000 09/01/2040 | 2.97% | 97.24 | 0.20% |
| FARMINGTON N MEX POLLUTN CTL REV NM 3.900 06/01/2040 | 2.47% | 101.34 | 0.04% |
|
USD Cash
|
2.44% | -- | -- |
| FARMINGTON N MEX POLLUTN CTL REV NM 3.875 06/01/2040 | 2.32% | 102.31 | 0.05% |
| NEW MEXICO ST UNIV REVS NM 5.000 04/01/2036 | 2.31% | 101.22 | 0.01% |
| GUAM PWR AUTH REV GU 5.000 10/01/2042 | 2.05% | 104.18 | 0.11% |
| NEW MEXICO MTG FIN AUTH NM 4.550 09/01/2043 | 1.74% | 99.97 | 0.22% |
Fees & Availability
| Fees | |
| Actual 12B-1 Fee | 0.25% |
| Actual Management Fee | 0.33% |
| Administration Fee | 28.38K% |
| Maximum Front Load | 2.00% |
| Maximum Deferred Load | -- |
| Maximum Redemption Fee | -- |
| General Availability | |
| Available for Insurance Product | No |
| Available for RRSP | No |
| Purchase Details | |
| Open to New Investors |
|
| Minimum Initial Investment | 5000.00 None |
| Minimum Subsequent Investment | 100.00 None |
Basic Info
| Investment Strategy | |
| The Fund seeks to obtain as high a level of current income exempts from federal and New Mexico state individual income taxes. The Fund invests in a laddered maturity portfolio of municipal obligations issued by the State of New Mexico and its agencies, and by New Mexico local governments and their agencies. |
| General | |
| Security Type | Mutual Fund |
| Equity Style | -- |
| Broad Asset Class | Municipal Bond |
| Broad Category | Fixed Income |
| Global Peer Group | Bond USD Municipal |
| Peer Group | Other States Intermediate Muni Debt Fds |
| Global Macro | Bond HC |
| US Macro | Single State Municipal Debt Funds |
| YCharts Categorization | -- |
| YCharts Benchmark | -- |
| Prospectus Objective | Other States Intermediate Muni Debt Fds |
| Fund Owner Firm Name | Thornburg |
| Broad Asset Class Benchmark Index | |
| ^BBMBTR | 100.0% |
Fundamentals
| General | |
| Distribution Yield | -- |
| Dividend Yield TTM (5-26-26) | 2.96% |
| 30-Day SEC Yield (4-30-26) | 2.68% |
| 7-Day SEC Yield | -- |
| Number of Holdings | 104 |
| Bond | |
| Yield to Maturity (3-31-26) | 3.59% |
| Effective Duration | -- |
| Average Coupon | 4.60% |
| Calculated Average Quality | 2.292 |
| Effective Maturity | 9.164 |
| Nominal Maturity | 11.71 |
| Number of Bond Holdings | 100 |
As of March 31, 2026
Fund Details
Top Portfolio Holders
| Name | % Weight |
|---|---|
| Portfolio A | 5.00% |
| Portfolio B | 3.50% |
| Portfolio C | 2.25% |
Excel Add-In Codes
| Name: =YCI("M:THNMX", "name") |
| Broad Asset Class: =YCI("M:THNMX", "broad_asset_class") |
| Broad Category: =YCI("M:THNMX", "broad_category_group") |
| Prospectus Objective: =YCI("M:THNMX", "prospectus_objective") |
| To find the codes for any of our securities and financial metrics, see our Complete Excel Reference. |