

Transamerica Floating Rate A (TFLAX)
8.71
0.00 (0.00%)
USD |
Jun 09 2026
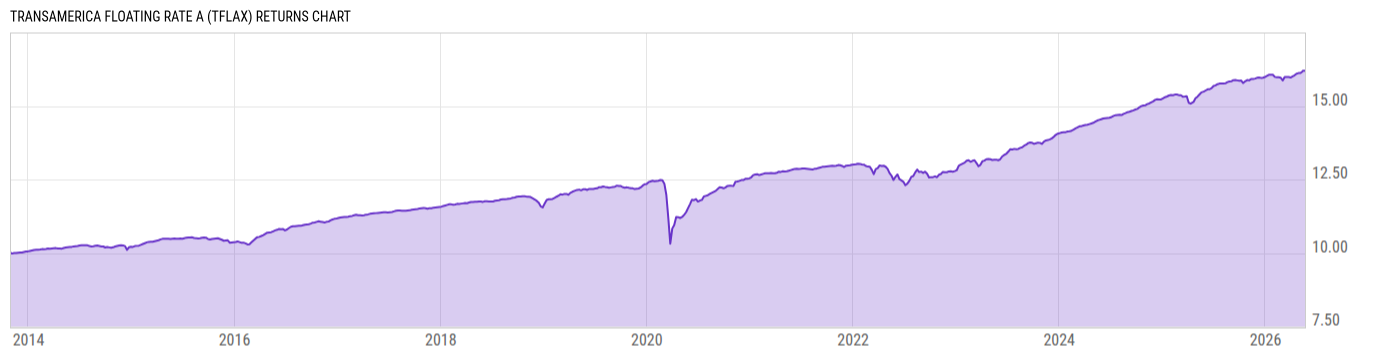
Returns Chart
Key Stats
| Net Expense Ratio | Total Assets Under Management | Weighted Average Dividend Yield | Turnover Ratio (Generic) |
|---|---|---|---|
| 0.98% | 246.81M | -- | 41.00% |
| 1 Year Fund Level Flows | 1 Year Total Returns (Daily) | Annualized Total Returns Since Inception (Daily) | Max Drawdown (Since Inception) |
| -38.83M | 4.30% |
Basic Info
| Investment Strategy | |
| The Fund seeks high level of current income with capital appreciation as a secondary objective. The Fund invests least 80% of its net assets in floating rate loans and floating rate debt securities. The Fund primarily invests in first lien, senior secured term loans to corporate issuers, partnerships and other entities. |
| General | |
| Security Type | Mutual Fund |
| Equity Style | -- |
| Broad Asset Class | Taxable Bond |
| Broad Category | Fixed Income |
| Global Peer Group | Loan Participation Funds |
| Peer Group | Loan Participation Funds |
| Global Macro | Loan Participation Funds |
| US Macro | General Domestic Taxable Fixed Income Funds |
| YCharts Categorization | -- |
| YCharts Benchmark | -- |
| Prospectus Objective | Loan Participation Funds |
| Fund Owner Firm Name | Transamerica |
| Broad Asset Class Benchmark Index | |
| ^BBUSATR | 100.0% |
Net Fund Flows Versus Peer Group
1 Month
% Rank:
29
-120.38M
Peer Group Low
1.130B
Peer Group High
1 Year
% Rank:
34
-38.83M
-1.857B
Peer Group Low
6.524B
Peer Group High
3 Months
% Rank:
29
-902.22M
Peer Group Low
2.516B
Peer Group High
3 Years
% Rank:
26
-2.611B
Peer Group Low
21.94B
Peer Group High
6 Months
% Rank:
33
-1.596B
Peer Group Low
4.432B
Peer Group High
5 Years
% Rank:
29
-4.547B
Peer Group Low
24.56B
Peer Group High
YTD
% Rank:
33
-1.334B
Peer Group Low
3.795B
Peer Group High
10 Years
% Rank:
49
-10.87B
Peer Group Low
25.40B
Peer Group High
Date Unavailable
Risk
Performance Versus Peer Group
Annual Total Returns Versus Peers
As of June 10, 2026.
Asset Allocation
As of March 31, 2026.
| Type | % Net |
|---|---|
| Cash | 3.85% |
| Stock | 0.28% |
| Bond | 95.93% |
| Convertible | 0.00% |
| Preferred | 0.00% |
| Other | -0.06% |
Top 10 Holdings
| Name | % Weight | Price | % Change |
|---|---|---|---|
|
Fixed Income Clearing Corp Repo
|
5.16% | -- | -- |
| TENET HEALTHCARE CORPORATION THC 6.125 06/15/2030 FIX USD Corporate | 1.25% | 100.69 | 0.06% |
| Allied Universal Holdco LLC ALLIUNI 7.875 02/15/2031 FIX USD Corporate 144A | 0.97% | 104.17 | 0.15% |
|
Petsmart Inc 18-AUG-2032 Term Loan B
|
0.92% | -- | -- |
|
Bausch & Lomb Inc 02-JAN-2031 Term Loan B
|
0.92% | -- | -- |
|
Flynn Restaurant Group LP 28-JAN-2032 Term Loan B
|
0.82% | -- | -- |
|
Magenta Security Holdings LLC FRN 27-Jul-2028
|
0.81% | -- | -- |
|
Nomad Foods Europe Midco Ltd FRN 29-Oct-2032
|
0.78% | -- | -- |
|
ProAmpac LLC [ex Ampac Packaging LLC] 06-MAR-2033 Delay Draw Term Loan
|
0.78% | -- | -- |
|
Pregis LLC 15-FEB-2029 Term Loan B
|
0.77% | -- | -- |
Fees & Availability
| Fees | |
| Actual 12B-1 Fee | 0.25% |
| Actual Management Fee | 0.46% |
| Administration Fee | -- |
| Maximum Front Load | 4.75% |
| Maximum Deferred Load | -- |
| Maximum Redemption Fee | -- |
| General Availability | |
| Available for Insurance Product | No |
| Available for RRSP | No |
| Purchase Details | |
| Open to New Investors |
|
| Minimum Initial Investment | 1000.00 None |
| Minimum Subsequent Investment | 50.00 None |
Basic Info
| Investment Strategy | |
| The Fund seeks high level of current income with capital appreciation as a secondary objective. The Fund invests least 80% of its net assets in floating rate loans and floating rate debt securities. The Fund primarily invests in first lien, senior secured term loans to corporate issuers, partnerships and other entities. |
| General | |
| Security Type | Mutual Fund |
| Equity Style | -- |
| Broad Asset Class | Taxable Bond |
| Broad Category | Fixed Income |
| Global Peer Group | Loan Participation Funds |
| Peer Group | Loan Participation Funds |
| Global Macro | Loan Participation Funds |
| US Macro | General Domestic Taxable Fixed Income Funds |
| YCharts Categorization | -- |
| YCharts Benchmark | -- |
| Prospectus Objective | Loan Participation Funds |
| Fund Owner Firm Name | Transamerica |
| Broad Asset Class Benchmark Index | |
| ^BBUSATR | 100.0% |
Fundamentals
| General | |
| Distribution Yield | -- |
| Dividend Yield TTM (6-8-26) | 7.20% |
| 30-Day SEC Yield (5-31-26) | 6.15% |
| 7-Day SEC Yield | -- |
| Number of Holdings | 290 |
| Bond | |
| Yield to Maturity (3-31-26) | 6.72% |
| Effective Duration | 0.45 |
| Average Coupon | 6.97% |
| Calculated Average Quality | 5.622 |
| Effective Maturity | 4.788 |
| Nominal Maturity | 4.805 |
| Number of Bond Holdings | 260 |
As of March 31, 2026
Fund Details
| Key Dates | |
| Inception Date | 10/31/2013 |
| Last Annual Report Date | 10/31/2025 |
| Last Prospectus Date | 3/1/2026 |
| Share Classes | |
| LP40205240 | I2 |
| TFLCX | C |
| TFLIX | Inst |
| Attributes | |
| Index Fund | -- |
| Inverse Fund | No |
| Leveraged Fund | -- |
| Fund of Funds | No |
| Currency Hedged Fund | -- |
| Socially Responsible Fund | No |
Top Portfolio Holders
| Name | % Weight |
|---|---|
| Portfolio A | 5.00% |
| Portfolio B | 3.50% |
| Portfolio C | 2.25% |
Excel Add-In Codes
| Name: =YCI("M:TFLAX", "name") |
| Broad Asset Class: =YCI("M:TFLAX", "broad_asset_class") |
| Broad Category: =YCI("M:TFLAX", "broad_category_group") |
| Prospectus Objective: =YCI("M:TFLAX", "prospectus_objective") |
| To find the codes for any of our securities and financial metrics, see our Complete Excel Reference. |