

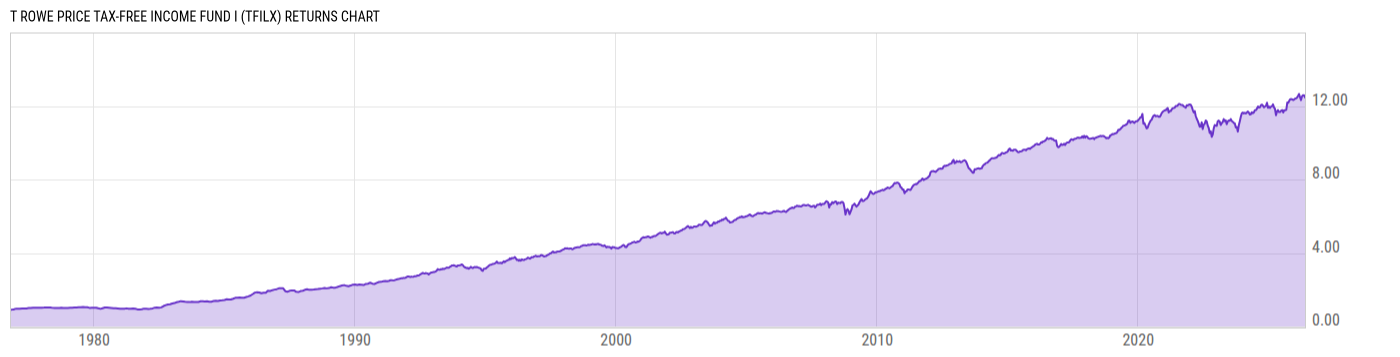
T Rowe Price Tax-Free Income Fund I (TFILX)
9.31
+0.01
(+0.11%)
USD |
May 22 2026
Returns Chart
Key Stats
| Net Expense Ratio | Total Assets Under Management | Weighted Average Dividend Yield | Turnover Ratio (Generic) |
|---|---|---|---|
| 0.35% | 2.278B | -- | 26.00% |
| 1 Year Fund Level Flows | 1 Year Total Returns (Daily) | Annualized Total Returns Since Inception (Daily) | Max Drawdown (Since Inception) |
| -62.27M | 7.03% |
Basic Info
| Investment Strategy | |
| The Fund seeks a high level of income exempt from federal income taxes by investing primarily in long-term, investment grade municipal securities. The Fund normally maintains a dollar-weighted average maturity greater than 15 years. |
| General | |
| Security Type | Mutual Fund |
| Equity Style | -- |
| Broad Asset Class | Municipal Bond |
| Broad Category | Fixed Income |
| Global Peer Group | Bond USD Municipal |
| Peer Group | General & Insured Municipal Debt Funds |
| Global Macro | Bond HC |
| US Macro | National Municipal Debt Funds |
| YCharts Categorization | -- |
| YCharts Benchmark | -- |
| Prospectus Objective | General & Insured Municipal Debt Funds |
| Fund Owner Firm Name | T. Rowe Price |
| Broad Asset Class Benchmark Index | |
| ^BBMBTR | 100.0% |
Net Fund Flows Versus Peer Group
1 Month
% Rank:
44
-99.16M
Peer Group Low
809.96M
Peer Group High
1 Year
% Rank:
70
-62.27M
-752.82M
Peer Group Low
6.079B
Peer Group High
3 Months
% Rank:
82
-397.00M
Peer Group Low
1.450B
Peer Group High
3 Years
% Rank:
78
-4.696B
Peer Group Low
16.26B
Peer Group High
6 Months
% Rank:
75
-636.26M
Peer Group Low
2.119B
Peer Group High
5 Years
% Rank:
75
-8.303B
Peer Group Low
33.26B
Peer Group High
YTD
% Rank:
82
-391.95M
Peer Group Low
1.826B
Peer Group High
10 Years
% Rank:
81
-7.392B
Peer Group Low
45.51B
Peer Group High
Date Unavailable
Risk
Performance Versus Peer Group
Annual Total Returns Versus Peers
As of May 23, 2026.
Asset Allocation
As of March 31, 2026.
| Type | % Net |
|---|---|
| Cash | 0.00% |
| Stock | 0.00% |
| Bond | 98.98% |
| Convertible | 0.00% |
| Preferred | 0.00% |
| Other | 1.02% |
Top 10 Holdings
| Name | % Weight | Price | % Change |
|---|---|---|---|
|
Other Assets less Liabilities
|
1.02% | -- | -- |
| PUERTO RICO SALES TAX FING CORP SALES TAX REV PR 4.750 07/01/2053 | 0.84% | 94.99 | 0.30% |
| NEW YORK ST TWY AUTH GEN REV JR INDBT OBLIGS NY 4.000 01/01/2040 | 0.78% | 97.61 | 0.21% |
| NORTH CAROLINA TPK AUTH TRIANGLE EXPWY SYS REV NC 5.000 01/01/2040 | 0.76% | 102.83 | 0.04% |
| REGIONAL TRANSN AUTH ILL IL 6.000 07/01/2033 | 0.75% | 115.60 | 0.07% |
| PUERTO RICO SALES TAX FING CORP SALES TAX REV PR 4.329 07/01/2040 | 0.72% | 98.60 | 0.19% |
| COLUMBIA CNTY GA HOSP AUTH REV GA 5.750 04/01/2053 | 0.69% | 106.82 | 0.10% |
| OKLAHOMA ST TPK AUTH TPK REV OK 5.500 01/01/2053 | 0.67% | 105.23 | 0.09% |
| NEW YORK ST DORM AUTH REVS NON ST SUPPORTED DEBT NY 5.500 07/01/2054 | 0.66% | 106.66 | 0.13% |
| MARYLAND ST HEALTH & HIGHER EDL FACS AUTH REV MD 5.500 01/01/2046 | 0.60% | 99.46 | 0.21% |
Fees & Availability
| Fees | |
| Actual 12B-1 Fee | -- |
| Actual Management Fee | 0.32% |
| Administration Fee | -- |
| Maximum Front Load | -- |
| Maximum Deferred Load | -- |
| Maximum Redemption Fee | -- |
| General Availability | |
| Available for Insurance Product | No |
| Available for RRSP | No |
| Purchase Details | |
| Open to New Investors |
|
| Minimum Initial Investment | 500000.0 None |
| Minimum Subsequent Investment | 0.00 None |
Basic Info
| Investment Strategy | |
| The Fund seeks a high level of income exempt from federal income taxes by investing primarily in long-term, investment grade municipal securities. The Fund normally maintains a dollar-weighted average maturity greater than 15 years. |
| General | |
| Security Type | Mutual Fund |
| Equity Style | -- |
| Broad Asset Class | Municipal Bond |
| Broad Category | Fixed Income |
| Global Peer Group | Bond USD Municipal |
| Peer Group | General & Insured Municipal Debt Funds |
| Global Macro | Bond HC |
| US Macro | National Municipal Debt Funds |
| YCharts Categorization | -- |
| YCharts Benchmark | -- |
| Prospectus Objective | General & Insured Municipal Debt Funds |
| Fund Owner Firm Name | T. Rowe Price |
| Broad Asset Class Benchmark Index | |
| ^BBMBTR | 100.0% |
Fundamentals
| General | |
| Distribution Yield | -- |
| Dividend Yield TTM (5-21-26) | 3.85% |
| 30-Day SEC Yield (4-30-26) | 3.79% |
| 7-Day SEC Yield | -- |
| Number of Holdings | 647 |
| Bond | |
| Yield to Maturity (3-31-26) | 4.26% |
| Effective Duration | 8.02 |
| Average Coupon | 4.82% |
| Calculated Average Quality | 2.561 |
| Effective Maturity | 15.69 |
| Nominal Maturity | 20.45 |
| Number of Bond Holdings | 627 |
As of March 31, 2026
Fund Details
Top Portfolio Holders
| Name | % Weight |
|---|---|
| Portfolio A | 5.00% |
| Portfolio B | 3.50% |
| Portfolio C | 2.25% |
Excel Add-In Codes
| Name: =YCI("M:TFILX", "name") |
| Broad Asset Class: =YCI("M:TFILX", "broad_asset_class") |
| Broad Category: =YCI("M:TFILX", "broad_category_group") |
| Prospectus Objective: =YCI("M:TFILX", "prospectus_objective") |
| To find the codes for any of our securities and financial metrics, see our Complete Excel Reference. |