

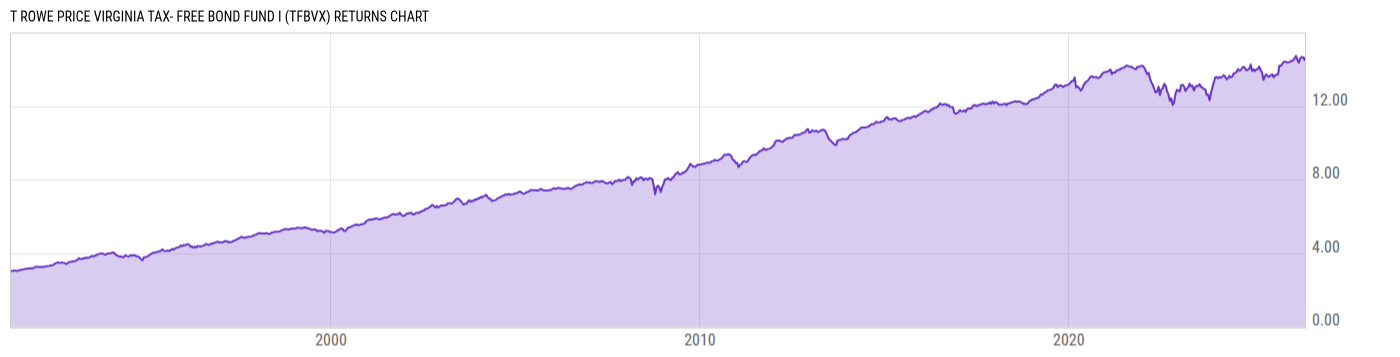
T Rowe Price Virginia Tax- Free Bond Fund I (TFBVX)
11.19
+0.03
(+0.27%)
USD |
May 27 2026
Returns Chart
Key Stats
| Net Expense Ratio | Total Assets Under Management | Weighted Average Dividend Yield | Turnover Ratio (Generic) |
|---|---|---|---|
| 0.43% | 1.480B | -- | 23.00% |
| 1 Year Fund Level Flows | 1 Year Total Returns (Daily) | Annualized Total Returns Since Inception (Daily) | Max Drawdown (Since Inception) |
| 97.13M | 7.27% |
Basic Info
| Investment Strategy | |
| The Fund seeks to provide investors the highest level of income exempt from federal and Virginia state income taxes by investing primarily in investment grade Virginia municipal securities. The Funds average maturity is expected to exceed 15 years. |
| General | |
| Security Type | Mutual Fund |
| Equity Style | -- |
| Broad Asset Class | Municipal Bond |
| Broad Category | Fixed Income |
| Global Peer Group | Bond USD Municipal |
| Peer Group | Virginia Municipal Debt Funds |
| Global Macro | Bond HC |
| US Macro | Single State Municipal Debt Funds |
| YCharts Categorization | -- |
| YCharts Benchmark | -- |
| Prospectus Objective | Virginia Municipal Debt Funds |
| Fund Owner Firm Name | T. Rowe Price |
| Broad Asset Class Benchmark Index | |
| ^BBMBTR | 100.0% |
Net Fund Flows Versus Peer Group
1 Month
% Rank:
7
-5.223M
Peer Group Low
13.99M
Peer Group High
1 Year
% Rank:
7
97.13M
-25.63M
Peer Group Low
97.13M
Peer Group High
3 Months
% Rank:
7
-6.482M
Peer Group Low
42.68M
Peer Group High
3 Years
% Rank:
7
-113.79M
Peer Group Low
71.16M
Peer Group High
6 Months
% Rank:
7
-18.79M
Peer Group Low
80.66M
Peer Group High
5 Years
% Rank:
86
-243.19M
Peer Group Low
2.125M
Peer Group High
YTD
% Rank:
7
-7.734M
Peer Group Low
63.13M
Peer Group High
10 Years
% Rank:
7
-307.55M
Peer Group Low
131.53M
Peer Group High
Date Unavailable
Risk
Performance Versus Peer Group
Annual Total Returns Versus Peers
As of May 28, 2026.
Asset Allocation
As of March 31, 2026.
| Type | % Net |
|---|---|
| Cash | 0.00% |
| Stock | 0.00% |
| Bond | 98.78% |
| Convertible | 0.00% |
| Preferred | 0.00% |
| Other | 1.22% |
Top 10 Holdings
| Name | % Weight | Price | % Change |
|---|---|---|---|
| METROPOLITAN WASH D C ARPTS AUTH DULLES TOLL RD REV DC 5.000 10/01/2044 | 2.01% | 102.07 | 0.04% |
| FARMVILLE VA INDL DEV AUTH EDL FACS REV VA 5.375 07/01/2053 | 1.47% | 104.44 | 0.04% |
| VIRGINIA SMALL BUSINESS FING AUTH PRIVATE ACTIVITY REV VA 5.000 12/31/2056 | 1.24% | 96.56 | 0.31% |
|
Other Assets less Liabilities
|
1.22% | -- | -- |
| VIRGINIA PORT AUTH COMWLTH PORT FD REV VA 5.250 07/01/2048 | 1.15% | 106.04 | 0.12% |
| HAMPTON RDS VA TRANSN ACCOUNTABILITY COMMN REV VA 5.000 07/01/2048 | 1.12% | 102.28 | 0.03% |
| PUERTO RICO SALES TAX FING CORP SALES TAX REV PR 4.329 07/01/2040 | 1.07% | 99.41 | -0.18% |
| PUERTO RICO SALES TAX FING CORP SALES TAX REV PR 4.750 07/01/2053 | 0.98% | 96.26 | 0.44% |
| VIRGINIA COLLEGE BLDG AUTH VA EDL FACS REV VA 5.000 03/01/2054 | 0.96% | 104.47 | 0.19% |
| VIRGINIA SMALL BUSINESS FING AUTH REV VA 4.000 01/01/2048 | 0.91% | 88.70 | 2.06% |
Fees & Availability
| Fees | |
| Actual 12B-1 Fee | -- |
| Actual Management Fee | 0.38% |
| Administration Fee | -- |
| Maximum Front Load | -- |
| Maximum Deferred Load | -- |
| Maximum Redemption Fee | -- |
| General Availability | |
| Available for Insurance Product | No |
| Available for RRSP | No |
| Purchase Details | |
| Open to New Investors |
|
| Minimum Initial Investment | 500000.0 None |
| Minimum Subsequent Investment | 0.00 None |
Basic Info
| Investment Strategy | |
| The Fund seeks to provide investors the highest level of income exempt from federal and Virginia state income taxes by investing primarily in investment grade Virginia municipal securities. The Funds average maturity is expected to exceed 15 years. |
| General | |
| Security Type | Mutual Fund |
| Equity Style | -- |
| Broad Asset Class | Municipal Bond |
| Broad Category | Fixed Income |
| Global Peer Group | Bond USD Municipal |
| Peer Group | Virginia Municipal Debt Funds |
| Global Macro | Bond HC |
| US Macro | Single State Municipal Debt Funds |
| YCharts Categorization | -- |
| YCharts Benchmark | -- |
| Prospectus Objective | Virginia Municipal Debt Funds |
| Fund Owner Firm Name | T. Rowe Price |
| Broad Asset Class Benchmark Index | |
| ^BBMBTR | 100.0% |
Fundamentals
| General | |
| Distribution Yield | -- |
| Dividend Yield TTM (5-26-26) | 3.45% |
| 30-Day SEC Yield (4-30-26) | 3.61% |
| 7-Day SEC Yield | -- |
| Number of Holdings | 408 |
| Bond | |
| Yield to Maturity (3-31-26) | 4.23% |
| Effective Duration | -- |
| Average Coupon | 4.46% |
| Calculated Average Quality | 2.276 |
| Effective Maturity | 12.68 |
| Nominal Maturity | 18.51 |
| Number of Bond Holdings | 406 |
As of March 31, 2026
Fund Details
| Key Dates | |
| Inception Date | 7/6/2017 |
| Last Annual Report Date | 2/28/2026 |
| Last Prospectus Date | 5/1/2025 |
| Share Classes | |
| PRVAX | Direct Sold |
| Attributes | |
| Index Fund | -- |
| Inverse Fund | No |
| Leveraged Fund | -- |
| Fund of Funds | No |
| Currency Hedged Fund | -- |
| Socially Responsible Fund | No |
Top Portfolio Holders
| Name | % Weight |
|---|---|
| Portfolio A | 5.00% |
| Portfolio B | 3.50% |
| Portfolio C | 2.25% |
Excel Add-In Codes
| Name: =YCI("M:TFBVX", "name") |
| Broad Asset Class: =YCI("M:TFBVX", "broad_asset_class") |
| Broad Category: =YCI("M:TFBVX", "broad_category_group") |
| Prospectus Objective: =YCI("M:TFBVX", "prospectus_objective") |
| To find the codes for any of our securities and financial metrics, see our Complete Excel Reference. |