

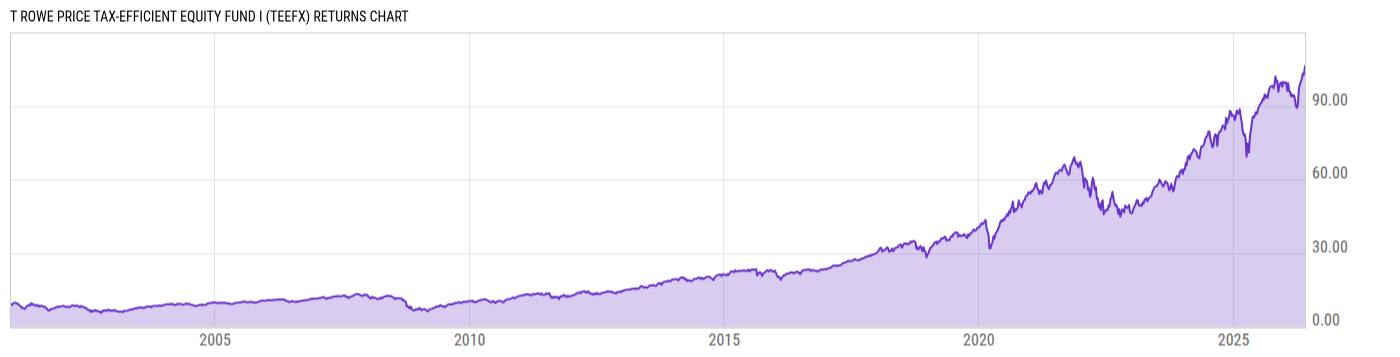
T Rowe Price Tax-Efficient Equity Fund I (TEEFX)
94.62
+0.97
(+1.04%)
USD |
May 28 2026
Returns Chart
Key Stats
| Net Expense Ratio | Total Assets Under Management | Weighted Average Dividend Yield | Turnover Ratio (Generic) |
|---|---|---|---|
| 0.68% | 1.534B | 0.49% | 17.00% |
| 1 Year Fund Level Flows | 1 Year Total Returns (Daily) | Annualized Total Returns Since Inception (Daily) | Max Drawdown (Since Inception) |
| -15.65M | 25.14% |
Basic Info
| Investment Strategy | |
| The Fund seeks to maximize after-tax growth of capital through investments primarily in common stocks. The Fund will invest primarily in the common stocks of mid-size and, to a lesser extent, small companies that we consider capable of delivering superior earnings growth over the long-term. |
| General | |
| Security Type | Mutual Fund |
| Equity Style | Multi Cap Growth |
| Broad Asset Class | US Equity |
| Broad Category | Equity |
| Global Peer Group | Equity US |
| Peer Group | Multi-Cap Growth Funds |
| Global Macro | Equity North America |
| US Macro | Multi-Cap Funds |
| YCharts Categorization | -- |
| YCharts Benchmark | -- |
| Prospectus Objective | Growth Funds |
| Fund Owner Firm Name | T. Rowe Price |
| Broad Asset Class Benchmark Index | |
| ^SPXTR | 100.0% |
Net Fund Flows Versus Peer Group
1 Month
% Rank:
46
-4.249B
Peer Group Low
1.587B
Peer Group High
1 Year
% Rank:
39
-15.65M
-11.40B
Peer Group Low
8.101B
Peer Group High
3 Months
% Rank:
40
-4.109B
Peer Group Low
3.748B
Peer Group High
3 Years
% Rank:
19
-23.90B
Peer Group Low
15.29B
Peer Group High
6 Months
% Rank:
33
-6.359B
Peer Group Low
4.169B
Peer Group High
5 Years
% Rank:
20
-30.62B
Peer Group Low
17.21B
Peer Group High
YTD
% Rank:
39
-4.841B
Peer Group Low
3.748B
Peer Group High
10 Years
% Rank:
17
-42.13B
Peer Group Low
17.21B
Peer Group High
Date Unavailable
Risk
Performance Versus Peer Group
Annual Total Returns Versus Peers
As of May 29, 2026.
Asset Allocation
As of March 31, 2026.
| Type | % Net |
|---|---|
| Cash | 0.06% |
| Stock | 99.22% |
| Bond | 0.06% |
| Convertible | 0.00% |
| Preferred | 0.00% |
| Other | 0.67% |
Top 10 Holdings
| Name | % Weight | Price | % Change |
|---|---|---|---|
| NVIDIA Corp. | 12.31% | 215.17 | 0.43% |
| Apple, Inc. | 8.98% | 311.48 | -0.33% |
| Microsoft Corp. | 7.22% | 443.60 | 3.89% |
| Alphabet, Inc. | 6.46% | 380.23 | -1.53% |
| Amazon.com, Inc. | 4.79% | 272.36 | -0.60% |
| Broadcom Inc. | 4.51% | 439.89 | 3.12% |
| Meta Platforms, Inc. | 3.54% | 628.67 | -1.04% |
| Tesla, Inc. | 3.09% | 433.01 | -2.06% |
| Eli Lilly & Co. | 2.58% | 1094.44 | -2.87% |
| Visa, Inc. | 1.79% | 330.95 | 1.85% |
Fees & Availability
| Fees | |
| Actual 12B-1 Fee | -- |
| Actual Management Fee | 0.63% |
| Administration Fee | -- |
| Maximum Front Load | -- |
| Maximum Deferred Load | -- |
| Maximum Redemption Fee | 0.00% |
| General Availability | |
| Available for Insurance Product | No |
| Available for RRSP | No |
| Purchase Details | |
| Open to New Investors |
|
| Minimum Initial Investment | 500000.0 None |
| Minimum Subsequent Investment | 0.00 None |
Basic Info
| Investment Strategy | |
| The Fund seeks to maximize after-tax growth of capital through investments primarily in common stocks. The Fund will invest primarily in the common stocks of mid-size and, to a lesser extent, small companies that we consider capable of delivering superior earnings growth over the long-term. |
| General | |
| Security Type | Mutual Fund |
| Equity Style | Multi Cap Growth |
| Broad Asset Class | US Equity |
| Broad Category | Equity |
| Global Peer Group | Equity US |
| Peer Group | Multi-Cap Growth Funds |
| Global Macro | Equity North America |
| US Macro | Multi-Cap Funds |
| YCharts Categorization | -- |
| YCharts Benchmark | -- |
| Prospectus Objective | Growth Funds |
| Fund Owner Firm Name | T. Rowe Price |
| Broad Asset Class Benchmark Index | |
| ^SPXTR | 100.0% |
Fundamentals
| General | |
| Distribution Yield | -- |
| Dividend Yield TTM (5-27-26) | 0.05% |
| 30-Day SEC Yield | -- |
| 7-Day SEC Yield | -- |
| Number of Holdings | 345 |
| Stock | |
| Weighted Average PE Ratio | 36.47 |
| Weighted Average Price to Sales Ratio | 10.52 |
| Weighted Average Price to Book Ratio | 15.48 |
| Weighted Median ROE | 121.9% |
| Weighted Median ROA | 24.01% |
| ROI (TTM) | 32.47% |
| Return on Investment (TTM) | 32.47% |
| Earning Yield | 0.0311 |
| LT Debt / Shareholders Equity | 0.7284 |
| Number of Equity Holdings | 341 |
As of March 31, 2026
Growth Metrics
| EPS Growth (1Y) | 32.90% |
| EPS Growth (3Y) | 31.59% |
| EPS Growth (5Y) | 34.59% |
| Sales Growth (1Y) | 22.88% |
| Sales Growth (3Y) | 24.44% |
| Sales Growth (5Y) | 23.28% |
| Sales per Share Growth (1Y) | 26.31% |
| Sales per Share Growth (3Y) | 24.67% |
| Operating Cash Flow - Growth Rate (3Y) | 41.50% |
As of March 31, 2026
Fund Details
| Key Dates | |
| Inception Date | 7/6/2017 |
| Last Annual Report Date | 2/28/2026 |
| Last Prospectus Date | 5/1/2025 |
| Share Classes | |
| PREFX | Direct Sold |
| Attributes | |
| Index Fund | -- |
| Inverse Fund | No |
| Leveraged Fund | -- |
| Fund of Funds | No |
| Currency Hedged Fund | -- |
| Socially Responsible Fund | No |
Top Portfolio Holders
| Name | % Weight |
|---|---|
| Portfolio A | 5.00% |
| Portfolio B | 3.50% |
| Portfolio C | 2.25% |
Excel Add-In Codes
| Name: =YCI("M:TEEFX", "name") |
| Broad Asset Class: =YCI("M:TEEFX", "broad_asset_class") |
| Broad Category: =YCI("M:TEEFX", "broad_category_group") |
| Prospectus Objective: =YCI("M:TEEFX", "prospectus_objective") |
| To find the codes for any of our securities and financial metrics, see our Complete Excel Reference. |