

Franklin Mutual Global Discovery Fund C (TEDSX)
31.47
+0.17
(+0.54%)
USD |
Jun 09 2026
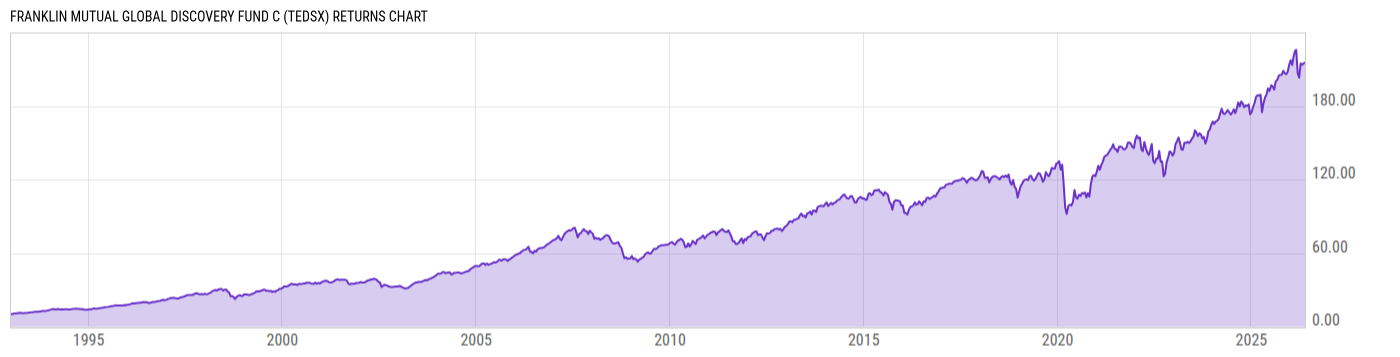
Returns Chart
Key Stats
| Net Expense Ratio | Total Assets Under Management | Weighted Average Dividend Yield | Turnover Ratio (Generic) |
|---|---|---|---|
| 1.95% | 9.163B | 2.49% | 42.00% |
| 1 Year Fund Level Flows | 1 Year Total Returns (Daily) | Annualized Total Returns Since Inception (Daily) | Max Drawdown (Since Inception) |
| -1.051B | 10.15% |
Basic Info
| Investment Strategy | |
| The Fund seeks capital appreciation. Under normal market conditions, the Fund invests mainly in equity securities of companies that the Manager believes are available at market prices less than their value based on certain recognized criteria. The fund generally invests a majority of its assets in foreign securities. |
| General | |
| Security Type | Mutual Fund |
| Equity Style | Large Cap Value |
| Broad Asset Class | International Equity |
| Broad Category | Equity |
| Global Peer Group | Equity Global |
| Peer Group | Global Large-Cap Value |
| Global Macro | Equity Global |
| US Macro | Developed Global Markets Funds |
| YCharts Categorization | -- |
| YCharts Benchmark | -- |
| Prospectus Objective | Global Funds |
| Fund Owner Firm Name | Franklin Templeton |
| Broad Asset Class Benchmark Index | |
| ^MSACXUSNTR | 100.0% |
Net Fund Flows Versus Peer Group
1 Month
% Rank:
94
-117.52M
Peer Group Low
95.38M
Peer Group High
1 Year
% Rank:
91
-1.051B
-1.447B
Peer Group Low
1.488B
Peer Group High
3 Months
% Rank:
94
-1.097B
Peer Group Low
432.80M
Peer Group High
3 Years
% Rank:
98
-3.349B
Peer Group Low
1.730B
Peer Group High
6 Months
% Rank:
91
-1.372B
Peer Group Low
1.040B
Peer Group High
5 Years
% Rank:
98
-5.438B
Peer Group Low
1.730B
Peer Group High
YTD
% Rank:
94
-1.327B
Peer Group Low
974.58M
Peer Group High
10 Years
% Rank:
98
-23.54B
Peer Group Low
2.135B
Peer Group High
Date Unavailable
Risk
Performance Versus Peer Group
Annual Total Returns Versus Peers
As of June 10, 2026.
Asset Allocation
As of April 30, 2026.
| Type | % Net |
|---|---|
| Cash | 0.31% |
| Stock | 96.35% |
| Bond | 1.84% |
| Convertible | 0.00% |
| Preferred | 0.00% |
| Other | 1.50% |
Top 10 Holdings
| Name | % Weight | Price | % Change |
|---|---|---|---|
| Alphabet, Inc. | 3.44% | 356.92 | -2.02% |
| BNP Paribas SA | 2.63% | 107.30 | -0.21% |
| BP Plc | 2.39% | 7.03 | -2.63% |
| EOG Resources, Inc. | 2.38% | 141.06 | 2.72% |
| Roche Holding AG | 2.27% | 399.00 | 0.55% |
| Merck & Co., Inc. | 2.20% | 119.00 | -0.50% |
| British American Tobacco plc | 2.15% | 62.06 | 0.31% |
| AerCap Holdings NV | 2.10% | 133.96 | -3.64% |
| Shell Plc | 2.05% | 43.40 | 2.04% |
| Bank of America Corp. | 2.02% | 54.73 | 0.57% |
Fees & Availability
| Fees | |
| Actual 12B-1 Fee | 1.00% |
| Actual Management Fee | 0.84% |
| Administration Fee | -- |
| Maximum Front Load | 0.00% |
| Maximum Deferred Load | 1.00% |
| Maximum Redemption Fee | 0.00% |
| General Availability | |
| Available for Insurance Product | No |
| Available for RRSP | No |
| Purchase Details | |
| Open to New Investors |
|
| Minimum Initial Investment | 1000.00 None |
| Minimum Subsequent Investment | 0.00 None |
Basic Info
| Investment Strategy | |
| The Fund seeks capital appreciation. Under normal market conditions, the Fund invests mainly in equity securities of companies that the Manager believes are available at market prices less than their value based on certain recognized criteria. The fund generally invests a majority of its assets in foreign securities. |
| General | |
| Security Type | Mutual Fund |
| Equity Style | Large Cap Value |
| Broad Asset Class | International Equity |
| Broad Category | Equity |
| Global Peer Group | Equity Global |
| Peer Group | Global Large-Cap Value |
| Global Macro | Equity Global |
| US Macro | Developed Global Markets Funds |
| YCharts Categorization | -- |
| YCharts Benchmark | -- |
| Prospectus Objective | Global Funds |
| Fund Owner Firm Name | Franklin Templeton |
| Broad Asset Class Benchmark Index | |
| ^MSACXUSNTR | 100.0% |
Fundamentals
| General | |
| Distribution Yield | -- |
| Dividend Yield TTM (6-8-26) | 0.88% |
| 30-Day SEC Yield | -- |
| 7-Day SEC Yield | -- |
| Number of Holdings | 10 |
| Stock | |
| Weighted Average PE Ratio | 21.55 |
| Weighted Average Price to Sales Ratio | 3.194 |
| Weighted Average Price to Book Ratio | 3.209 |
| Weighted Median ROE | 16.76% |
| Weighted Median ROA | 6.05% |
| ROI (TTM) | 10.43% |
| Return on Investment (TTM) | 10.43% |
| Earning Yield | 0.0604 |
| LT Debt / Shareholders Equity | 0.7575 |
| Number of Equity Holdings | 10 |
As of April 30, 2026
Growth Metrics
| EPS Growth (1Y) | 13.44% |
| EPS Growth (3Y) | 8.20% |
| EPS Growth (5Y) | 11.13% |
| Sales Growth (1Y) | 5.39% |
| Sales Growth (3Y) | 4.33% |
| Sales Growth (5Y) | 7.36% |
| Sales per Share Growth (1Y) | 5.87% |
| Sales per Share Growth (3Y) | 5.73% |
| Operating Cash Flow - Growth Rate (3Y) | 8.00% |
As of April 30, 2026
Fund Details
Top Portfolio Holders
| Name | % Weight |
|---|---|
| Portfolio A | 5.00% |
| Portfolio B | 3.50% |
| Portfolio C | 2.25% |
Excel Add-In Codes
| Name: =YCI("M:TEDSX", "name") |
| Broad Asset Class: =YCI("M:TEDSX", "broad_asset_class") |
| Broad Category: =YCI("M:TEDSX", "broad_category_group") |
| Prospectus Objective: =YCI("M:TEDSX", "prospectus_objective") |
| To find the codes for any of our securities and financial metrics, see our Complete Excel Reference. |