

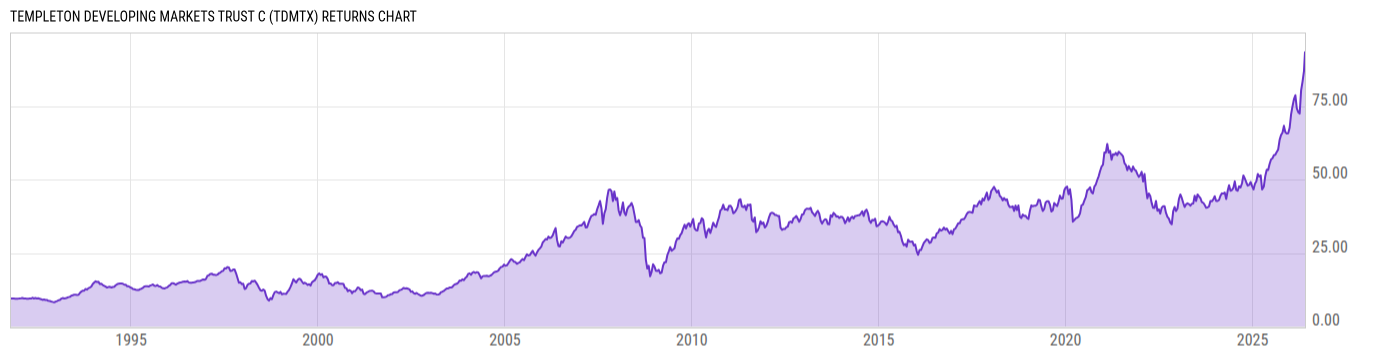
Templeton Developing Markets Trust C (TDMTX)
35.61
+0.21
(+0.59%)
USD |
May 28 2026
Returns Chart
Key Stats
| Net Expense Ratio | Total Assets Under Management | Weighted Average Dividend Yield | Turnover Ratio (Generic) |
|---|---|---|---|
| 2.13% | 2.406B | 2.77% | 19.00% |
| 1 Year Fund Level Flows | 1 Year Total Returns (Daily) | Annualized Total Returns Since Inception (Daily) | Max Drawdown (Since Inception) |
| 247.85M | 75.88% |
Basic Info
| Investment Strategy | |
| The Fund seeks long-term capital appreciation by investing at least 65% of its assets in equity securities of developing market countries. Developing market countries include those considered to be developing by the World Bank, the International Finance Corporation, or the United Nations. |
| General | |
| Security Type | Mutual Fund |
| Equity Style | Large Cap Core |
| Broad Asset Class | International Equity |
| Broad Category | Equity |
| Global Peer Group | Equity Emerging Markets Global |
| Peer Group | Emerging Markets Funds |
| Global Macro | Equity Emerging Markets |
| US Macro | Emerging Markets Equity Funds |
| YCharts Categorization | -- |
| YCharts Benchmark | -- |
| Prospectus Objective | Emerging Markets Funds |
| Fund Owner Firm Name | Franklin Templeton |
| Broad Asset Class Benchmark Index | |
| ^MSACXUSNTR | 100.0% |
Net Fund Flows Versus Peer Group
1 Month
% Rank:
30
-358.80M
Peer Group Low
3.871B
Peer Group High
1 Year
% Rank:
11
247.85M
-9.182B
Peer Group Low
23.63B
Peer Group High
3 Months
% Rank:
13
-1.224B
Peer Group Low
4.035B
Peer Group High
3 Years
% Rank:
16
-20.75B
Peer Group Low
24.84B
Peer Group High
6 Months
% Rank:
16
-3.043B
Peer Group Low
16.03B
Peer Group High
5 Years
% Rank:
48
-33.03B
Peer Group Low
32.30B
Peer Group High
YTD
% Rank:
13
-1.656B
Peer Group Low
11.15B
Peer Group High
10 Years
% Rank:
80
-33.31B
Peer Group Low
78.43B
Peer Group High
Date Unavailable
Risk
Performance Versus Peer Group
Annual Total Returns Versus Peers
As of May 29, 2026.
Asset Allocation
As of March 31, 2026.
| Type | % Net |
|---|---|
| Cash | 0.10% |
| Stock | 94.67% |
| Bond | 0.00% |
| Convertible | 0.00% |
| Preferred | 2.00% |
| Other | 3.23% |
Top 10 Holdings
| Name | % Weight | Price | % Change |
|---|---|---|---|
| Taiwan Semiconductor Manufacturing Co., Ltd. | 14.53% | 17.24 | 0.00% |
|
SK HYNIX INC ORD
|
9.25% | -- | -- |
| Samsung Electronics Co., Ltd. | 7.13% | 140.00 | 0.00% |
|
MEDIATEK INC ORD
|
3.34% | -- | -- |
| Franklin Institutional US Government Money Mrkt Fd | 3.26% | 1.00 | 0.00% |
| Prosus NV | 2.99% | 45.45 | 0.00% |
|
ICICI BANK LTD ORD
|
2.15% | -- | -- |
| BYD Co., Ltd. | 2.05% | 11.54 | -0.77% |
| Hyundai Motor Co., Ltd. | 2.04% | 89.00 | 0.00% |
| Grupo Financiero Banorte SAB de CV | 2.04% | 11.16 | -6.51% |
Fees & Availability
| Fees | |
| Actual 12B-1 Fee | 1.00% |
| Actual Management Fee | 0.92% |
| Administration Fee | -- |
| Maximum Front Load | 0.00% |
| Maximum Deferred Load | 1.00% |
| Maximum Redemption Fee | 0.00% |
| General Availability | |
| Available for Insurance Product | -- |
| Available for RRSP | -- |
| Purchase Details | |
| Open to New Investors |
|
| Minimum Initial Investment | 1000.00 None |
| Minimum Subsequent Investment | 0.00 None |
Basic Info
| Investment Strategy | |
| The Fund seeks long-term capital appreciation by investing at least 65% of its assets in equity securities of developing market countries. Developing market countries include those considered to be developing by the World Bank, the International Finance Corporation, or the United Nations. |
| General | |
| Security Type | Mutual Fund |
| Equity Style | Large Cap Core |
| Broad Asset Class | International Equity |
| Broad Category | Equity |
| Global Peer Group | Equity Emerging Markets Global |
| Peer Group | Emerging Markets Funds |
| Global Macro | Equity Emerging Markets |
| US Macro | Emerging Markets Equity Funds |
| YCharts Categorization | -- |
| YCharts Benchmark | -- |
| Prospectus Objective | Emerging Markets Funds |
| Fund Owner Firm Name | Franklin Templeton |
| Broad Asset Class Benchmark Index | |
| ^MSACXUSNTR | 100.0% |
Fundamentals
| General | |
| Distribution Yield | -- |
| Dividend Yield TTM (5-27-26) | 0.82% |
| 30-Day SEC Yield | -- |
| 7-Day SEC Yield | -- |
| Number of Holdings | 10 |
| Stock | |
| Weighted Average PE Ratio | 19.28 |
| Weighted Average Price to Sales Ratio | 5.584 |
| Weighted Average Price to Book Ratio | 3.570 |
| Weighted Median ROE | 19.52% |
| Weighted Median ROA | 11.38% |
| ROI (TTM) | 17.15% |
| Return on Investment (TTM) | 17.15% |
| Earning Yield | 0.0673 |
| LT Debt / Shareholders Equity | 0.3694 |
| Number of Equity Holdings | 9 |
As of March 31, 2026
Growth Metrics
| EPS Growth (1Y) | 29.98% |
| EPS Growth (3Y) | 16.32% |
| EPS Growth (5Y) | 22.83% |
| Sales Growth (1Y) | 15.73% |
| Sales Growth (3Y) | 11.88% |
| Sales Growth (5Y) | 15.02% |
| Sales per Share Growth (1Y) | 16.22% |
| Sales per Share Growth (3Y) | 12.08% |
| Operating Cash Flow - Growth Rate (3Y) | 17.41% |
As of March 31, 2026
Fund Details
Top Portfolio Holders
| Name | % Weight |
|---|---|
| Portfolio A | 5.00% |
| Portfolio B | 3.50% |
| Portfolio C | 2.25% |
Excel Add-In Codes
| Name: =YCI("M:TDMTX", "name") |
| Broad Asset Class: =YCI("M:TDMTX", "broad_asset_class") |
| Broad Category: =YCI("M:TDMTX", "broad_category_group") |
| Prospectus Objective: =YCI("M:TDMTX", "prospectus_objective") |
| To find the codes for any of our securities and financial metrics, see our Complete Excel Reference. |