

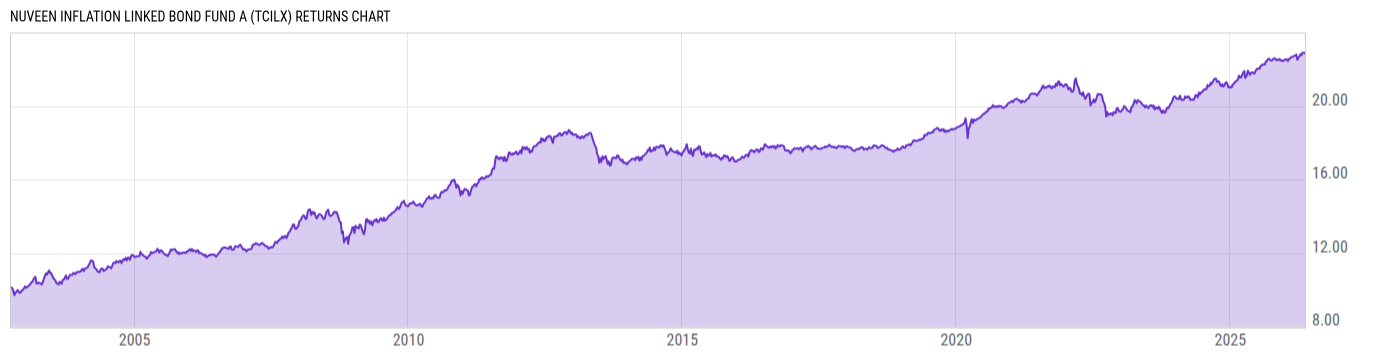
Nuveen Inflation Linked Bond Fund A (TCILX)
10.53
0.00 (0.00%)
USD |
Jun 08 2026
Returns Chart
Key Stats
| Net Expense Ratio | Total Assets Under Management | Weighted Average Dividend Yield | Turnover Ratio (Generic) |
|---|---|---|---|
| 0.59% | 3.252B | -- | 27.00% |
| 1 Year Fund Level Flows | 1 Year Total Returns (Daily) | Annualized Total Returns Since Inception (Daily) | Max Drawdown (Since Inception) |
| 139.14M | 4.60% |
Basic Info
| Investment Strategy | |
| The Fund seeks to provide inflation protection and income, primarily through investment in inflation-linked bonds. It invests at least 80% of assets in fixed-income securities whose principal value increases or decreases based on changes in the Consumer Price Index for All Urban Consumers, over the life of the security. |
| General | |
| Security Type | Mutual Fund |
| Equity Style | -- |
| Broad Asset Class | Taxable Bond |
| Broad Category | Fixed Income |
| Global Peer Group | Bond USD Inflation Linked |
| Peer Group | Inflation Protected Bond Funds |
| Global Macro | Bond HC |
| US Macro | Short-/Intermediate-Term U.S. Government & Treasury Funds |
| YCharts Categorization | -- |
| YCharts Benchmark | -- |
| Prospectus Objective | Inflation Protected Bond Funds |
| Fund Owner Firm Name | Nuveen |
| Broad Asset Class Benchmark Index | |
| ^BBUSATR | 100.0% |
Net Fund Flows Versus Peer Group
1 Month
% Rank:
6
-80.30M
Peer Group Low
1.937B
Peer Group High
1 Year
% Rank:
15
139.14M
-839.78M
Peer Group Low
9.912B
Peer Group High
3 Months
% Rank:
70
-968.21M
Peer Group Low
4.610B
Peer Group High
3 Years
% Rank:
29
-8.412B
Peer Group Low
17.47B
Peer Group High
6 Months
% Rank:
74
-1.074B
Peer Group Low
5.312B
Peer Group High
5 Years
% Rank:
78
-12.69B
Peer Group Low
17.47B
Peer Group High
YTD
% Rank:
43
-1.270B
Peer Group Low
4.299B
Peer Group High
10 Years
% Rank:
81
-6.738B
Peer Group Low
45.84B
Peer Group High
Date Unavailable
Risk
Performance Versus Peer Group
Annual Total Returns Versus Peers
As of June 09, 2026.
Asset Allocation
As of April 30, 2026.
| Type | % Net |
|---|---|
| Cash | 0.13% |
| Stock | 0.00% |
| Bond | 98.25% |
| Convertible | 0.00% |
| Preferred | 0.00% |
| Other | 1.62% |
Top 10 Holdings
| Name | % Weight | Price | % Change |
|---|---|---|---|
| United States of America USGB 1.75 01/15/2034 FIX USD Government | 5.94% | 98.07 | 0.19% |
| United States of America USGB 1.25 04/15/2028 FIX USD Government | 5.36% | 99.41 | 0.01% |
| United States of America USGB 2.125 01/15/2035 FIX USD Government | 5.10% | 100.15 | 0.21% |
| United States of America USGB 1.625 04/15/2030 FIX USD Government | 4.56% | 99.54 | 0.05% |
| United States of America USGB 0.125 01/15/2031 FIX USD Government | 4.41% | 92.86 | 0.09% |
| United States of America USGB 2.125 04/15/2029 FIX USD Government | 4.37% | 101.26 | 0.05% |
| United States of America USGB 0.125 07/15/2031 FIX USD Government | 4.21% | 92.24 | 0.11% |
| United States of America USGB 1.125 10/15/2030 FIX USD Government | 4.17% | 97.72 | 0.08% |
| United States of America USGB 1.125 01/15/2033 FIX USD Government | 3.95% | 94.99 | 0.13% |
| United States of America USGB 0.125 07/15/2030 FIX USD Government | 3.84% | 94.02 | 0.08% |
Fees & Availability
| Fees | |
| Actual 12B-1 Fee | 0.25% |
| Actual Management Fee | 0.24% |
| Administration Fee | -- |
| Maximum Front Load | 3.75% |
| Maximum Deferred Load | -- |
| Maximum Redemption Fee | -- |
| General Availability | |
| Available for Insurance Product | -- |
| Available for RRSP | -- |
| Purchase Details | |
| Open to New Investors |
|
| Minimum Initial Investment | 2500.00 None |
| Minimum Subsequent Investment | 100.00 None |
Basic Info
| Investment Strategy | |
| The Fund seeks to provide inflation protection and income, primarily through investment in inflation-linked bonds. It invests at least 80% of assets in fixed-income securities whose principal value increases or decreases based on changes in the Consumer Price Index for All Urban Consumers, over the life of the security. |
| General | |
| Security Type | Mutual Fund |
| Equity Style | -- |
| Broad Asset Class | Taxable Bond |
| Broad Category | Fixed Income |
| Global Peer Group | Bond USD Inflation Linked |
| Peer Group | Inflation Protected Bond Funds |
| Global Macro | Bond HC |
| US Macro | Short-/Intermediate-Term U.S. Government & Treasury Funds |
| YCharts Categorization | -- |
| YCharts Benchmark | -- |
| Prospectus Objective | Inflation Protected Bond Funds |
| Fund Owner Firm Name | Nuveen |
| Broad Asset Class Benchmark Index | |
| ^BBUSATR | 100.0% |
Fundamentals
| General | |
| Distribution Yield | -- |
| Dividend Yield TTM (6-5-26) | 3.05% |
| 30-Day SEC Yield (5-31-26) | 12.72% |
| 7-Day SEC Yield | -- |
| Number of Holdings | 46 |
| Bond | |
| Yield to Maturity (4-30-26) | 1.26% |
| Effective Duration | 4.47 |
| Average Coupon | 1.36% |
| Calculated Average Quality | 1.988 |
| Effective Maturity | 4.912 |
| Nominal Maturity | 4.912 |
| Number of Bond Holdings | 43 |
As of April 30, 2026
Fund Details
| Key Dates | |
| Inception Date | 10/1/2002 |
| Last Annual Report Date | 12/31/2025 |
| Last Prospectus Date | 5/1/2026 |
| Share Classes | |
| TIIHX | Inst |
| TIILX | Retirement |
| TIIWX | Other |
| TIKPX | Premier |
| TIKRX | Retirement |
| Attributes | |
| Index Fund | -- |
| Inverse Fund | -- |
| Leveraged Fund | -- |
| Fund of Funds | No |
| Currency Hedged Fund | -- |
| Socially Responsible Fund | No |
Top Portfolio Holders
| Name | % Weight |
|---|---|
| Portfolio A | 5.00% |
| Portfolio B | 3.50% |
| Portfolio C | 2.25% |
Excel Add-In Codes
| Name: =YCI("M:TCILX", "name") |
| Broad Asset Class: =YCI("M:TCILX", "broad_asset_class") |
| Broad Category: =YCI("M:TCILX", "broad_category_group") |
| Prospectus Objective: =YCI("M:TCILX", "prospectus_objective") |
| To find the codes for any of our securities and financial metrics, see our Complete Excel Reference. |