

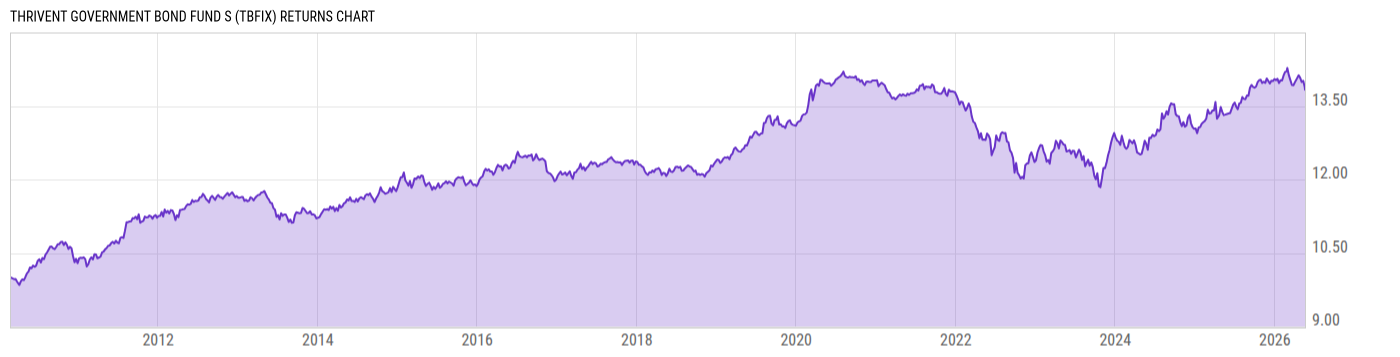
Thrivent Government Bond Fund S (TBFIX)
8.75
-0.01
(-0.11%)
USD |
Jun 08 2026
Returns Chart
Key Stats
| Net Expense Ratio | Total Assets Under Management | Weighted Average Dividend Yield | Turnover Ratio (Generic) |
|---|---|---|---|
| 0.45% | 45.32M | -- | 352.0% |
| 1 Year Fund Level Flows | 1 Year Total Returns (Daily) | Annualized Total Returns Since Inception (Daily) | Max Drawdown (Since Inception) |
| 3.352M | 4.51% |
Basic Info
| Investment Strategy | |
| The Fund seeks total return with current income consistent with preservation of capital. Under normal circumstances, the Fund invests at least 80% of its net assets in U.S. government bonds. The Fund's portfolio securities may be of any maturity. |
| General | |
| Security Type | Mutual Fund |
| Equity Style | -- |
| Broad Asset Class | Taxable Bond |
| Broad Category | Fixed Income |
| Global Peer Group | Bond USD Government |
| Peer Group | General U.S. Government Funds |
| Global Macro | Bond Government |
| US Macro | U.S. Government & Treasury Fixed Income Funds |
| YCharts Categorization | -- |
| YCharts Benchmark | -- |
| Prospectus Objective | General U.S. Government Funds |
| Fund Owner Firm Name | Thrivent |
| Broad Asset Class Benchmark Index | |
| ^BBUSATR | 100.0% |
Net Fund Flows Versus Peer Group
1 Month
% Rank:
48
-25.32M
Peer Group Low
199.39M
Peer Group High
1 Year
% Rank:
29
3.352M
-553.03M
Peer Group Low
844.39M
Peer Group High
3 Months
% Rank:
47
-126.15M
Peer Group Low
26.15M
Peer Group High
3 Years
% Rank:
51
-2.253B
Peer Group Low
2.274B
Peer Group High
6 Months
% Rank:
35
-248.12M
Peer Group Low
445.04M
Peer Group High
5 Years
% Rank:
51
-2.067B
Peer Group Low
3.211B
Peer Group High
YTD
% Rank:
41
-153.55M
Peer Group Low
355.14M
Peer Group High
10 Years
% Rank:
49
-3.426B
Peer Group Low
13.80B
Peer Group High
Date Unavailable
Risk
Performance Versus Peer Group
Annual Total Returns Versus Peers
As of June 09, 2026.
Asset Allocation
As of April 30, 2026.
| Type | % Net |
|---|---|
| Cash | 1.45% |
| Stock | 0.00% |
| Bond | 99.33% |
| Convertible | 0.00% |
| Preferred | 0.00% |
| Other | -0.78% |
Top 10 Holdings
| Name | % Weight | Price | % Change |
|---|---|---|---|
| United States of America USGB 3.875 03/31/2031 FIX USD Government | 16.74% | 98.52 | 0.14% |
| United States of America USGB 4.25 03/31/2033 FIX USD Government | 14.25% | 99.29 | 0.20% |
| United States of America USGB 3.5 02/15/2029 FIX USD Government | 11.71% | 98.29 | 0.09% |
| United States of America USGB 3.375 02/29/2028 FIX USD Government | 5.51% | 98.78 | 0.04% |
| United States of America USGB 4.75 02/15/2056 FIX USD Government | 3.45% | 96.01 | 0.57% |
| United States of America USGB 4.125 02/15/2036 FIX USD Government | 3.23% | 96.91 | 0.30% |
| State Street US Government Money Market Fund Prem | 3.02% | 1.00 | 0.00% |
| FHLMC-New 4.0 08/25/2052 FIX USD Agency | 1.69% | 92.77 | 0.13% |
| United States of America USGB 4.625 02/15/2046 FIX USD Government | 1.47% | 94.99 | 0.52% |
|
FEDERAL NATIONAL MORTGAGE ASSOCIATION 01-MAR-2062 BF0617
|
1.43% | -- | -- |
Fees & Availability
| Fees | |
| Actual 12B-1 Fee | -- |
| Actual Management Fee | 0.22% |
| Administration Fee | 82.92K% |
| Maximum Front Load | -- |
| Maximum Deferred Load | -- |
| Maximum Redemption Fee | -- |
| General Availability | |
| Available for Insurance Product | No |
| Available for RRSP | No |
| Purchase Details | |
| Open to New Investors |
|
| Minimum Initial Investment | 2000.00 None |
| Minimum Subsequent Investment | 50.00 None |
Basic Info
| Investment Strategy | |
| The Fund seeks total return with current income consistent with preservation of capital. Under normal circumstances, the Fund invests at least 80% of its net assets in U.S. government bonds. The Fund's portfolio securities may be of any maturity. |
| General | |
| Security Type | Mutual Fund |
| Equity Style | -- |
| Broad Asset Class | Taxable Bond |
| Broad Category | Fixed Income |
| Global Peer Group | Bond USD Government |
| Peer Group | General U.S. Government Funds |
| Global Macro | Bond Government |
| US Macro | U.S. Government & Treasury Fixed Income Funds |
| YCharts Categorization | -- |
| YCharts Benchmark | -- |
| Prospectus Objective | General U.S. Government Funds |
| Fund Owner Firm Name | Thrivent |
| Broad Asset Class Benchmark Index | |
| ^BBUSATR | 100.0% |
Fundamentals
| General | |
| Distribution Yield | -- |
| Dividend Yield TTM (6-5-26) | 3.81% |
| 30-Day SEC Yield (5-31-26) | 4.01% |
| 7-Day SEC Yield | -- |
| Number of Holdings | 10 |
| Bond | |
| Yield to Maturity (4-30-26) | 4.47% |
| Effective Duration | 5.64 |
| Average Coupon | 3.94% |
| Calculated Average Quality | 1.889 |
| Effective Maturity | 14.14 |
| Nominal Maturity | 14.14 |
| Number of Bond Holdings | 9 |
As of April 30, 2026
Fund Details
| Key Dates | |
| Inception Date | 2/26/2010 |
| Last Annual Report Date | 10/31/2025 |
| Last Prospectus Date | 2/27/2026 |
| Share Classes | |
| TBFAX | A |
| Attributes | |
| Index Fund | -- |
| Inverse Fund | No |
| Leveraged Fund | -- |
| Fund of Funds | No |
| Currency Hedged Fund | -- |
| Socially Responsible Fund | No |
Top Portfolio Holders
| Name | % Weight |
|---|---|
| Portfolio A | 5.00% |
| Portfolio B | 3.50% |
| Portfolio C | 2.25% |
Excel Add-In Codes
| Name: =YCI("M:TBFIX", "name") |
| Broad Asset Class: =YCI("M:TBFIX", "broad_asset_class") |
| Broad Category: =YCI("M:TBFIX", "broad_category_group") |
| Prospectus Objective: =YCI("M:TBFIX", "prospectus_objective") |
| To find the codes for any of our securities and financial metrics, see our Complete Excel Reference. |