

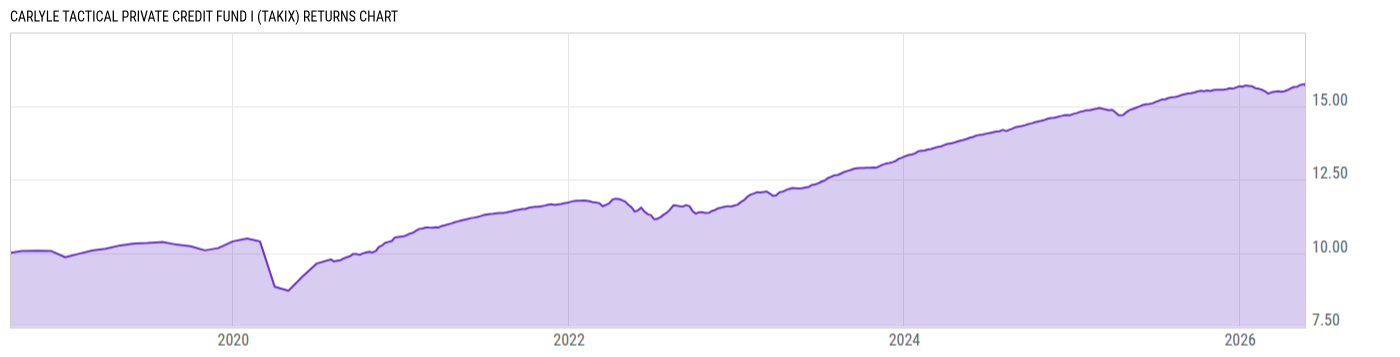
Carlyle Tactical Private Credit Fund I (TAKIX)
8.12
+0.01
(+0.12%)
USD |
May 21 2026
Returns Chart
Key Stats
| Net Expense Ratio | Total Assets Under Management | Weighted Average Dividend Yield | Turnover Ratio (Generic) |
|---|---|---|---|
| 5.65% | 4.563B | -- | -- |
| 1 Year Fund Level Flows | 1 Year Total Returns (Daily) | Annualized Total Returns Since Inception (Daily) | Max Drawdown (Since Inception) |
| -- | 5.05% |
Basic Info
| Investment Strategy | |
| The Fund seeks to produce current income. It invests at least 80% of its assets in private fixed-income securities and credit instruments. It will allocate its assets across any number of the following credit strategies: (a) liquid credit; (b) direct lending; (c) opportunistic credit; and (d) loans and structured credit. |
| General | |
| Security Type | Unlisted Closed-End Fund |
| Equity Style | -- |
| Broad Asset Class | Taxable Bond |
| Broad Category | Fixed Income |
| Global Peer Group | Bond Global USD |
| Peer Group | Global Income Funds |
| Global Macro | Bond Global |
| US Macro | World Income Funds |
| YCharts Categorization | -- |
| YCharts Benchmark | -- |
| Prospectus Objective | Global Income Funds |
| Fund Owner Firm Name | Carlyle |
| Broad Asset Class Benchmark Index | |
| ^BBUSATR | 100.0% |
Net Fund Flows Versus Peer Group
1 Month
% Rank:
--
-312.18M
Peer Group Low
211.27M
Peer Group High
1 Year
% Rank:
--
-1.130B
Peer Group Low
1.493B
Peer Group High
3 Months
% Rank:
--
-461.90M
Peer Group Low
567.54M
Peer Group High
3 Years
% Rank:
--
-2.542B
Peer Group Low
2.711B
Peer Group High
6 Months
% Rank:
--
-771.56M
Peer Group Low
851.14M
Peer Group High
5 Years
% Rank:
--
-8.824B
Peer Group Low
3.278B
Peer Group High
YTD
% Rank:
--
-485.30M
Peer Group Low
617.06M
Peer Group High
10 Years
% Rank:
--
-48.28B
Peer Group Low
4.453B
Peer Group High
Date Unavailable
Risk
Performance Versus Peer Group
Annual Total Returns Versus Peers
As of May 22, 2026.
Asset Allocation
As of December 31, 2025.
| Type | % Net |
|---|---|
| Cash | 3.72% |
| Stock | 0.43% |
| Bond | 144.5% |
| Convertible | 0.00% |
| Preferred | 5.04% |
| Other | -53.71% |
Top 10 Holdings
| Name | % Weight | Price | % Change |
|---|---|---|---|
|
CASH AND CASH EQUIVALENTS
|
3.05% | -- | -- |
| State Street US Government Money Market Fund Prem | 1.77% | 1.00 | 0.00% |
|
VENSURE EMPLOYER SERVICES INC 27-SEP-2031 TERM LOAN
|
1.52% | -- | -- |
|
SPOTLESS BRANDS LLC FRN 25-JUL-2028
|
1.49% | -- | -- |
|
YOUR.WORLD HOLDCO BV PFD
|
1.48% | -- | -- |
|
DANCE MIDCO SARL FRN 22-AUG-2031
|
1.44% | -- | -- |
|
DEERFIELD DAKOTA HOLDING LLC FRN 13-SEP-2032
|
1.35% | -- | -- |
|
ROME BIDCO LTD FRN 23-DEC-2027
|
1.30% | -- | -- |
|
EXCELITAS TECHNOLOGIES CORP FRN 13-AUG-2029
|
1.29% | -- | -- |
|
BIANALISI SPA FRN 26-FEB-2032
|
1.26% | -- | -- |
Fees & Availability
| Fees | |
| Actual 12B-1 Fee | -- |
| Actual Management Fee | 2.84% |
| Administration Fee | 1.29M% |
| Maximum Front Load | -- |
| Maximum Deferred Load | -- |
| Maximum Redemption Fee | -- |
| General Availability | |
| Available for Insurance Product | No |
| Available for RRSP | No |
| Purchase Details | |
| Open to New Investors |
|
| Minimum Initial Investment | 250000.0 None |
| Minimum Subsequent Investment | 5000.00 None |
Basic Info
| Investment Strategy | |
| The Fund seeks to produce current income. It invests at least 80% of its assets in private fixed-income securities and credit instruments. It will allocate its assets across any number of the following credit strategies: (a) liquid credit; (b) direct lending; (c) opportunistic credit; and (d) loans and structured credit. |
| General | |
| Security Type | Unlisted Closed-End Fund |
| Equity Style | -- |
| Broad Asset Class | Taxable Bond |
| Broad Category | Fixed Income |
| Global Peer Group | Bond Global USD |
| Peer Group | Global Income Funds |
| Global Macro | Bond Global |
| US Macro | World Income Funds |
| YCharts Categorization | -- |
| YCharts Benchmark | -- |
| Prospectus Objective | Global Income Funds |
| Fund Owner Firm Name | Carlyle |
| Broad Asset Class Benchmark Index | |
| ^BBUSATR | 100.0% |
Fundamentals
| General | |
| Distribution Yield | -- |
| Dividend Yield TTM (5-20-26) | 8.93% |
| 30-Day SEC Yield | -- |
| 7-Day SEC Yield | -- |
| Number of Holdings | 698 |
| Bond | |
| Yield to Maturity (12-31-25) | 8.82% |
| Effective Duration | -- |
| Average Coupon | 9.64% |
| Calculated Average Quality | 5.408 |
| Effective Maturity | 6.360 |
| Nominal Maturity | 6.361 |
| Number of Bond Holdings | 645 |
As of December 31, 2025
Fund Details
| Key Dates | |
| Launch Date | 9/4/2018 |
| Last Annual Report Date | 12/31/2025 |
| Last Prospectus Date | 4/30/2025 |
| Share Classes | |
| TAKAX | A |
| TAKLX | Other |
| TAKMX | M |
| TAKNX | Other |
| TAKUX | Other |
| TAKYX | Inst |
| Attributes | |
| Index Fund | -- |
| Inverse Fund | No |
| Leveraged Fund |
|
| Fund of Funds | No |
| Currency Hedged Fund | -- |
| Socially Responsible Fund | No |
Top Portfolio Holders
| Name | % Weight |
|---|---|
| Portfolio A | 5.00% |
| Portfolio B | 3.50% |
| Portfolio C | 2.25% |