

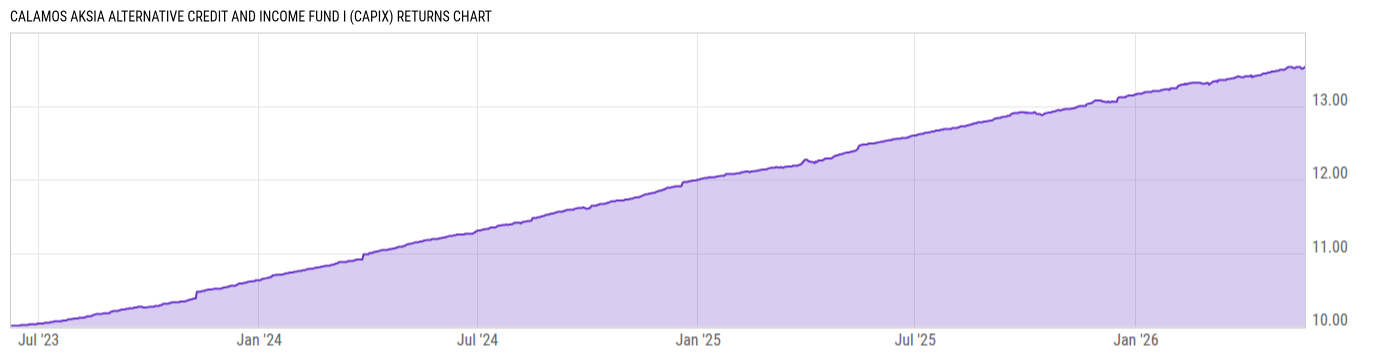
Calamos Aksia Alternative Credit and Income Fund I (CAPIX)
10.55
+0.01
(+0.09%)
USD |
May 21 2026
Returns Chart
Key Stats
| Net Expense Ratio | Total Assets Under Management | Weighted Average Dividend Yield | Turnover Ratio (Generic) |
|---|---|---|---|
| 2.96% | 1.076B | -- | 54.00% |
| 1 Year Fund Level Flows | 1 Year Total Returns (Daily) | Annualized Total Returns Since Inception (Daily) | Max Drawdown (Since Inception) |
| -- | 8.35% |
Basic Info
| Investment Strategy | |
| The Fund seeks attractive risk-adjusted returns and high current income by primarily investing in credit and income-related instruments. Across the private credit asset class, with the remainder of the Funds assets invested in one or more liquid alternative investment strategies, which seek to outperform cash yields. |
| General | |
| Security Type | Unlisted Closed-End Fund |
| Equity Style | -- |
| Broad Asset Class | Taxable Bond |
| Broad Category | Fixed Income |
| Global Peer Group | Bond Global USD |
| Peer Group | Global Income Funds |
| Global Macro | Bond Global |
| US Macro | World Income Funds |
| YCharts Categorization | -- |
| YCharts Benchmark | -- |
| Prospectus Objective | Global Income Funds |
| Fund Owner Firm Name | Calamos |
| Broad Asset Class Benchmark Index | |
| ^BBUSATR | 100.0% |
Net Fund Flows Versus Peer Group
1 Month
% Rank:
--
-312.18M
Peer Group Low
211.27M
Peer Group High
1 Year
% Rank:
--
-1.130B
Peer Group Low
1.493B
Peer Group High
3 Months
% Rank:
--
-461.90M
Peer Group Low
567.54M
Peer Group High
3 Years
% Rank:
--
-2.542B
Peer Group Low
2.711B
Peer Group High
6 Months
% Rank:
--
-771.56M
Peer Group Low
851.14M
Peer Group High
5 Years
% Rank:
--
-8.824B
Peer Group Low
3.278B
Peer Group High
YTD
% Rank:
--
-485.30M
Peer Group Low
617.06M
Peer Group High
10 Years
% Rank:
--
-48.28B
Peer Group Low
4.453B
Peer Group High
Date Unavailable
Risk
Performance Versus Peer Group
Annual Total Returns Versus Peers
As of May 22, 2026.
Asset Allocation
As of December 31, 2025.
| Type | % Net |
|---|---|
| Cash | 1.50% |
| Stock | 7.34% |
| Bond | 104.2% |
| Convertible | 0.00% |
| Preferred | 2.08% |
| Other | -15.10% |
Top 10 Holdings
| Name | % Weight | Price | % Change |
|---|---|---|---|
|
AR3 HOLDCO LLC FRN 16-MAR-2027
|
2.06% | -- | -- |
|
STONE POINT CREDIT FUND
|
2.05% | -- | -- |
|
BLAZING STAR PARENT LLC FRN 28-AUG-2030
|
2.00% | -- | -- |
|
LYRIC PINEAPPLE LP
|
1.95% | -- | -- |
|
C1RH HEALTHCARE PURCHASER FRN 17-SEP-2031
|
1.77% | -- | -- |
|
ICG EUROPEAN DIRECT LENDING
|
1.67% | -- | -- |
|
SKY 65 FRANKLIN LLC FRN 09-SEP-2028
|
1.52% | -- | -- |
|
JEPPESEN HOLDINGS LLC FRN 31-OCT-2032
|
1.52% | -- | -- |
|
BADGE 21 MIDCO HOLDINGS LLC FRN 30-JUN-2032
|
1.52% | -- | -- |
|
B1ISHOP STREET UNDER FRN 31-JUL-2031
|
1.52% | -- | -- |
Fees & Availability
| Fees | |
| Actual 12B-1 Fee | -- |
| Actual Management Fee | 0.78% |
| Administration Fee | 103.6K% |
| Maximum Front Load | -- |
| Maximum Deferred Load | -- |
| Maximum Redemption Fee | -- |
| General Availability | |
| Available for Insurance Product | No |
| Available for RRSP | No |
| Purchase Details | |
| Open to New Investors |
|
| Minimum Initial Investment | 1.00M None |
| Minimum Subsequent Investment | 0.00 None |
Basic Info
| Investment Strategy | |
| The Fund seeks attractive risk-adjusted returns and high current income by primarily investing in credit and income-related instruments. Across the private credit asset class, with the remainder of the Funds assets invested in one or more liquid alternative investment strategies, which seek to outperform cash yields. |
| General | |
| Security Type | Unlisted Closed-End Fund |
| Equity Style | -- |
| Broad Asset Class | Taxable Bond |
| Broad Category | Fixed Income |
| Global Peer Group | Bond Global USD |
| Peer Group | Global Income Funds |
| Global Macro | Bond Global |
| US Macro | World Income Funds |
| YCharts Categorization | -- |
| YCharts Benchmark | -- |
| Prospectus Objective | Global Income Funds |
| Fund Owner Firm Name | Calamos |
| Broad Asset Class Benchmark Index | |
| ^BBUSATR | 100.0% |
Fundamentals
| General | |
| Distribution Yield | -- |
| Dividend Yield TTM (5-20-26) | 9.19% |
| 30-Day SEC Yield | -- |
| 7-Day SEC Yield | -- |
| Number of Holdings | 291 |
| Stock | |
| Weighted Average PE Ratio | -- |
| Weighted Average Price to Sales Ratio | -- |
| Weighted Average Price to Book Ratio | -- |
| Weighted Median ROE | -- |
| Weighted Median ROA | -- |
| ROI (TTM) | -- |
| Return on Investment (TTM) | -- |
| Earning Yield | -- |
| LT Debt / Shareholders Equity | -- |
| Number of Equity Holdings | 23 |
| Bond | |
| Yield to Maturity (12-31-25) | 4.80% |
| Effective Duration | -- |
| Average Coupon | 15.09% |
| Calculated Average Quality | 5.831 |
| Effective Maturity | 4.558 |
| Nominal Maturity | 4.559 |
| Number of Bond Holdings | 245 |
As of December 31, 2025
Growth Metrics
| EPS Growth (1Y) | -- |
| EPS Growth (3Y) | -- |
| EPS Growth (5Y) | -- |
| Sales Growth (1Y) | -- |
| Sales Growth (3Y) | -- |
| Sales Growth (5Y) | -- |
| Sales per Share Growth (1Y) | -- |
| Sales per Share Growth (3Y) | -- |
| Operating Cash Flow - Growth Rate (3Y) | -- |
As of December 31, 2025
Top Portfolio Holders
| Name | % Weight |
|---|---|
| Portfolio A | 5.00% |
| Portfolio B | 3.50% |
| Portfolio C | 2.25% |