

American Funds Tax-Awr Constv Gro and I P C (TAICX)
17.59
+0.03
(+0.17%)
USD |
Jun 09 2026
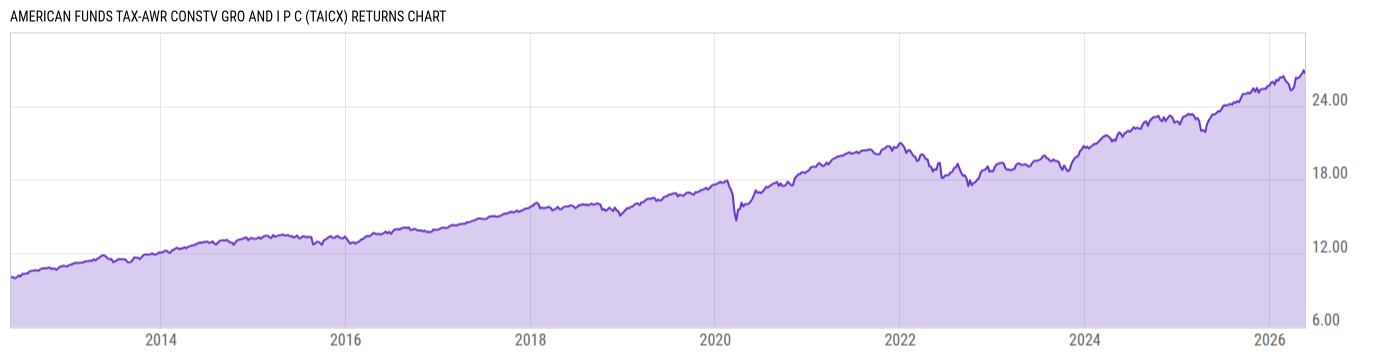
Returns Chart
Key Stats
| Net Expense Ratio | Total Assets Under Management | Weighted Average Dividend Yield | Turnover Ratio (Generic) |
|---|---|---|---|
| 1.36% | 6.666B | -- | 39.00% |
| 1 Year Fund Level Flows | 1 Year Total Returns (Daily) | Annualized Total Returns Since Inception (Daily) | Max Drawdown (Since Inception) |
| 312.86M | 14.32% |
Basic Info
| Investment Strategy | |
| The Fund seeks to provide current income while secondarily striving for long-term growth of capital. Under normal market conditions, the Fund will seek to generate material portion of its current income from underlying funds that invest in bonds that are exempt from regular income tax, such as municipal bonds. |
| General | |
| Security Type | Mutual Fund |
| Equity Style | -- |
| Broad Asset Class | Allocation |
| Broad Category | Allocation |
| Global Peer Group | Mixed Asset USD Balanced - US |
| Peer Group | Mixed-Asset Target Alloc Moderate Funds |
| Global Macro | Mixed Asset HC Balanced |
| US Macro | Mixed-Assets Target Allocation Funds |
| YCharts Categorization | -- |
| YCharts Benchmark | -- |
| Prospectus Objective | Growth Funds |
| Fund Owner Firm Name | Capital Group/American Funds |
| Broad Asset Class Benchmark Index | |
| ^SPXTR | 100.0% |
Net Fund Flows Versus Peer Group
1 Month
% Rank:
1
-365.62M
Peer Group Low
32.29M
Peer Group High
1 Year
% Rank:
2
312.86M
-5.510B
Peer Group Low
642.22M
Peer Group High
3 Months
% Rank:
1
-1.193B
Peer Group Low
97.62M
Peer Group High
3 Years
% Rank:
3
-21.36B
Peer Group Low
3.106B
Peer Group High
6 Months
% Rank:
3
-3.729B
Peer Group Low
576.03M
Peer Group High
5 Years
% Rank:
2
-30.46B
Peer Group Low
2.725B
Peer Group High
YTD
% Rank:
2
-1.851B
Peer Group Low
585.46M
Peer Group High
10 Years
% Rank:
1
-51.73B
Peer Group Low
3.718B
Peer Group High
Date Unavailable
Risk
Performance Versus Peer Group
Annual Total Returns Versus Peers
As of June 10, 2026.
Asset Allocation
As of March 31, 2026.
| Type | % Net |
|---|---|
| Cash | 0.56% |
| Stock | 12.39% |
| Bond | 0.01% |
| Convertible | 0.00% |
| Preferred | 0.03% |
| Other | 87.01% |
Top 10 Holdings
| Name | % Weight | Price | % Change |
|---|---|---|---|
|
CAPITAL GROUP MNCPL HG INC ETF
|
24.55% | -- | -- |
| Capital Group Municipal Income ETF | 20.53% | 27.40 | 0.00% |
| Capital Group Dividend Value ETF | 15.77% | 48.12 | 0.38% |
| American Funds Capital World Gro & Inc Fd R6 | 12.61% | 80.15 | 0.09% |
| Capital Group Dividend Growers ETF | 10.04% | 37.22 | 0.76% |
|
CAPITAL GROUP CONSERTVE EQT ETF
|
4.78% | -- | -- |
|
CAPITAL GROUP GLOBAL EQUITY ETF
|
3.95% | -- | -- |
|
CAPITAL GROUP CORE EQUITY ETF
|
3.76% | -- | -- |
| Capital Group Short Duration Municipal Income ETF | 3.64% | 26.37 | 0.04% |
|
Capital Group Central Cash Fund; Class M
|
0.39% | -- | -- |
Fees & Availability
| Fees | |
| Actual 12B-1 Fee | 1.00% |
| Actual Management Fee | 0.00% |
| Administration Fee | -- |
| Maximum Front Load | -- |
| Maximum Deferred Load | 1.00% |
| Maximum Redemption Fee | -- |
| General Availability | |
| Available for Insurance Product | No |
| Available for RRSP | No |
| Purchase Details | |
| Open to New Investors |
|
| Minimum Initial Investment | 250.00 None |
| Minimum Subsequent Investment | 50.00 None |
Basic Info
| Investment Strategy | |
| The Fund seeks to provide current income while secondarily striving for long-term growth of capital. Under normal market conditions, the Fund will seek to generate material portion of its current income from underlying funds that invest in bonds that are exempt from regular income tax, such as municipal bonds. |
| General | |
| Security Type | Mutual Fund |
| Equity Style | -- |
| Broad Asset Class | Allocation |
| Broad Category | Allocation |
| Global Peer Group | Mixed Asset USD Balanced - US |
| Peer Group | Mixed-Asset Target Alloc Moderate Funds |
| Global Macro | Mixed Asset HC Balanced |
| US Macro | Mixed-Assets Target Allocation Funds |
| YCharts Categorization | -- |
| YCharts Benchmark | -- |
| Prospectus Objective | Growth Funds |
| Fund Owner Firm Name | Capital Group/American Funds |
| Broad Asset Class Benchmark Index | |
| ^SPXTR | 100.0% |
Fundamentals
| General | |
| Distribution Yield | -- |
| Dividend Yield TTM (6-8-26) | 1.50% |
| 30-Day SEC Yield (4-30-26) | 1.37% |
| 7-Day SEC Yield | -- |
| Number of Holdings | 11 |
Top Portfolio Holders
| Name | % Weight |
|---|---|
| Portfolio A | 5.00% |
| Portfolio B | 3.50% |
| Portfolio C | 2.25% |
Excel Add-In Codes
| Name: =YCI("M:TAICX", "name") |
| Broad Asset Class: =YCI("M:TAICX", "broad_asset_class") |
| Broad Category: =YCI("M:TAICX", "broad_category_group") |
| Prospectus Objective: =YCI("M:TAICX", "prospectus_objective") |
| To find the codes for any of our securities and financial metrics, see our Complete Excel Reference. |