

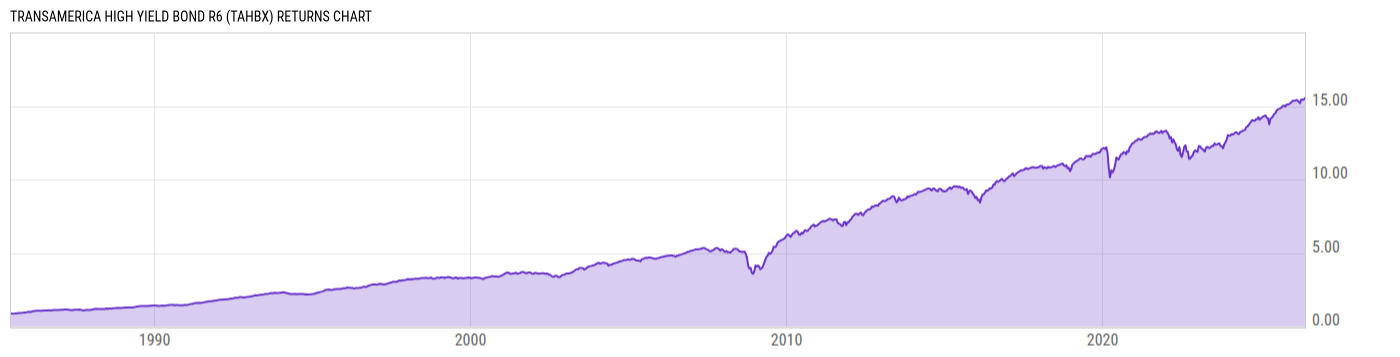
Transamerica High Yield Bond R6 (TAHBX)
8.17
0.00 (0.00%)
USD |
May 29 2026
Returns Chart
Key Stats
| Net Expense Ratio | Total Assets Under Management | Weighted Average Dividend Yield | Turnover Ratio (Generic) |
|---|---|---|---|
| 0.61% | 835.18M | -- | 42.00% |
| 1 Year Fund Level Flows | 1 Year Total Returns (Daily) | Annualized Total Returns Since Inception (Daily) | Max Drawdown (Since Inception) |
| -470.44M | 7.97% |
Basic Info
| Investment Strategy | |
| The Fund seeks a high level of current income by investing at least 80% of its assets in a diversified portfolio of high-yield/high-risk bonds (commonly known as "junk bonds"). |
| General | |
| Security Type | Mutual Fund |
| Equity Style | -- |
| Broad Asset Class | Taxable Bond |
| Broad Category | Fixed Income |
| Global Peer Group | Bond USD High Yield |
| Peer Group | High Yield Funds |
| Global Macro | Bond High Yield |
| US Macro | High Yield Funds |
| YCharts Categorization | -- |
| YCharts Benchmark | -- |
| Prospectus Objective | High Yield Funds |
| Fund Owner Firm Name | Transamerica |
| Broad Asset Class Benchmark Index | |
| ^BBUSATR | 100.0% |
Net Fund Flows Versus Peer Group
1 Month
% Rank:
52
-2.560B
Peer Group Low
1.905B
Peer Group High
1 Year
% Rank:
91
-470.44M
-2.841B
Peer Group Low
12.05B
Peer Group High
3 Months
% Rank:
61
-2.713B
Peer Group Low
735.45M
Peer Group High
3 Years
% Rank:
91
-4.325B
Peer Group Low
12.80B
Peer Group High
6 Months
% Rank:
60
-2.866B
Peer Group Low
1.236B
Peer Group High
5 Years
% Rank:
89
-7.728B
Peer Group Low
14.73B
Peer Group High
YTD
% Rank:
59
-3.074B
Peer Group Low
1.049B
Peer Group High
10 Years
% Rank:
77
-10.71B
Peer Group Low
21.54B
Peer Group High
Date Unavailable
Risk
Performance Versus Peer Group
Annual Total Returns Versus Peers
As of May 30, 2026.
Asset Allocation
As of April 30, 2026.
| Type | % Net |
|---|---|
| Cash | 2.72% |
| Stock | 0.47% |
| Bond | 97.12% |
| Convertible | 0.00% |
| Preferred | 0.00% |
| Other | -0.31% |
Top 10 Holdings
| Name | % Weight | Price | % Change |
|---|---|---|---|
| Constellation Insurance, Inc. CONSTEI 6.8 01/24/2030 VAR USD Corporate 144A | 1.55% | 100.08 | 0.58% |
| ILFC E-CAPITAL TRUST I ILFCECA 5.49905 12/21/2065 FLT USD Corporate 144A '10 | 1.48% | 85.93 | 0.35% |
|
Fixed Income Clearing Corp Repo
|
1.24% | -- | -- |
|
UKG Inc [Ex- Ultimate Software Inc] 09-FEB-2031 Term Loan B
|
1.17% | -- | -- |
| Magnera Corporation MAGNERC 7.25 11/15/2031 FIX USD Corporate 144A | 1.15% | 96.78 | -0.03% |
| VMED O2 UK FINANCING I PLC VMEDFIN 7.75 04/15/2032 FIX USD Corporate 144A | 1.04% | 93.96 | 0.44% |
| UWM Holdings, LLC UWMHO 6.625 02/01/2030 FIX USD Corporate 144A | 0.99% | 94.95 | 0.46% |
| OLYMPUS WATER US HOLDING CORPORATION OLYMPWA 7.25 02/15/2033 FIX USD Corporate 144A | 0.97% | 98.93 | 0.31% |
| Park Intermediate Holdings LLC PARKINT 7.0 02/01/2030 FIX USD Corporate 144A | 0.95% | 102.42 | 0.04% |
| MAUSER PACKAGING SOLUTIONS HOLDING COMPANY MAUSPAC 7.875 04/15/2030 FIX USD Corporate 144A | 0.94% | 101.33 | 0.18% |
Fees & Availability
| Fees | |
| Actual 12B-1 Fee | -- |
| Actual Management Fee | 0.55% |
| Administration Fee | -- |
| Maximum Front Load | -- |
| Maximum Deferred Load | -- |
| Maximum Redemption Fee | -- |
| General Availability | |
| Available for Insurance Product | No |
| Available for RRSP | No |
| Purchase Details | |
| Open to New Investors |
|
| Minimum Initial Investment | 0.00 None |
| Minimum Subsequent Investment | 0.00 None |
Basic Info
| Investment Strategy | |
| The Fund seeks a high level of current income by investing at least 80% of its assets in a diversified portfolio of high-yield/high-risk bonds (commonly known as "junk bonds"). |
| General | |
| Security Type | Mutual Fund |
| Equity Style | -- |
| Broad Asset Class | Taxable Bond |
| Broad Category | Fixed Income |
| Global Peer Group | Bond USD High Yield |
| Peer Group | High Yield Funds |
| Global Macro | Bond High Yield |
| US Macro | High Yield Funds |
| YCharts Categorization | -- |
| YCharts Benchmark | -- |
| Prospectus Objective | High Yield Funds |
| Fund Owner Firm Name | Transamerica |
| Broad Asset Class Benchmark Index | |
| ^BBUSATR | 100.0% |
Fundamentals
| General | |
| Distribution Yield | -- |
| Dividend Yield TTM (5-29-26) | 7.00% |
| 30-Day SEC Yield (4-30-26) | 6.92% |
| 7-Day SEC Yield | -- |
| Number of Holdings | 233 |
| Bond | |
| Yield to Maturity (4-30-26) | 6.18% |
| Effective Duration | 3.01 |
| Average Coupon | 7.23% |
| Calculated Average Quality | 5.574 |
| Effective Maturity | 5.716 |
| Nominal Maturity | 7.042 |
| Number of Bond Holdings | 214 |
As of April 30, 2026
Fund Details
| Key Dates | |
| Inception Date | 5/29/2015 |
| Last Annual Report Date | 10/31/2025 |
| Last Prospectus Date | 3/1/2025 |
| Share Classes | |
| IHIYX | A |
| INCLX | C |
| LP40110600 | I2 |
| TAHFX | Retirement |
| TAHRX | Retirement |
| TAHTX | Other |
| TDHIX | Inst |
| Attributes | |
| Index Fund | -- |
| Inverse Fund | No |
| Leveraged Fund | -- |
| Fund of Funds | No |
| Currency Hedged Fund | -- |
| Socially Responsible Fund | No |
Top Portfolio Holders
| Name | % Weight |
|---|---|
| Portfolio A | 5.00% |
| Portfolio B | 3.50% |
| Portfolio C | 2.25% |
Excel Add-In Codes
| Name: =YCI("M:TAHBX", "name") |
| Broad Asset Class: =YCI("M:TAHBX", "broad_asset_class") |
| Broad Category: =YCI("M:TAHBX", "broad_category_group") |
| Prospectus Objective: =YCI("M:TAHBX", "prospectus_objective") |
| To find the codes for any of our securities and financial metrics, see our Complete Excel Reference. |