

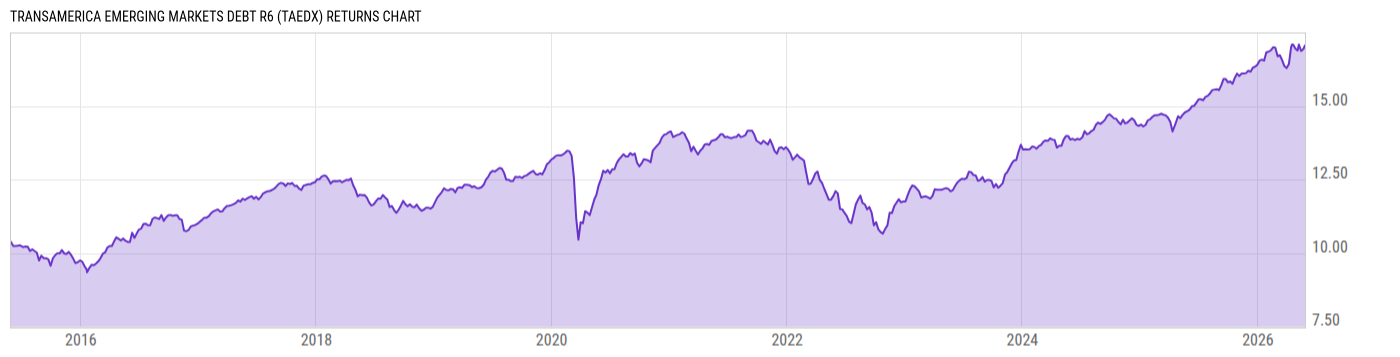
Transamerica Emerging Markets Debt R6 (TAEDX)
9.97
+0.02
(+0.20%)
USD |
May 27 2026
Returns Chart
Key Stats
| Net Expense Ratio | Total Assets Under Management | Weighted Average Dividend Yield | Turnover Ratio (Generic) |
|---|---|---|---|
| 0.77% | 254.14M | -- | 199.0% |
| 1 Year Fund Level Flows | 1 Year Total Returns (Daily) | Annualized Total Returns Since Inception (Daily) | Max Drawdown (Since Inception) |
| -13.24M | 15.05% |
Basic Info
| Investment Strategy | |
| The Fund seeks to generate a high total return through a combination of capital appreciation and income. The Fund invests at least 80% of its net assets in debt securities of issuers located in emerging markets countries. |
| General | |
| Security Type | Mutual Fund |
| Equity Style | -- |
| Broad Asset Class | Taxable Bond |
| Broad Category | Fixed Income |
| Global Peer Group | Bond Emerging Markets Global HC |
| Peer Group | Emerging Mrkts Hard Currency Debt Funds |
| Global Macro | Bond Emerging Markets |
| US Macro | Emerging Markets Debt Funds |
| YCharts Categorization | -- |
| YCharts Benchmark | -- |
| Prospectus Objective | Emerging Mrkts Hard Currency Debt Funds |
| Fund Owner Firm Name | Transamerica |
| Broad Asset Class Benchmark Index | |
| ^BBUSATR | 100.0% |
Net Fund Flows Versus Peer Group
1 Month
% Rank:
79
-242.33M
Peer Group Low
2.418B
Peer Group High
1 Year
% Rank:
72
-13.24M
-1.336B
Peer Group Low
3.073B
Peer Group High
3 Months
% Rank:
49
-2.371B
Peer Group Low
2.435B
Peer Group High
3 Years
% Rank:
72
-4.272B
Peer Group Low
4.881B
Peer Group High
6 Months
% Rank:
48
-1.694B
Peer Group Low
2.761B
Peer Group High
5 Years
% Rank:
68
-5.278B
Peer Group Low
4.646B
Peer Group High
YTD
% Rank:
46
-2.245B
Peer Group Low
2.777B
Peer Group High
10 Years
% Rank:
86
-6.484B
Peer Group Low
5.936B
Peer Group High
Date Unavailable
Risk
Performance Versus Peer Group
Annual Total Returns Versus Peers
As of May 28, 2026.
Asset Allocation
As of March 31, 2026.
| Type | % Net |
|---|---|
| Cash | 3.91% |
| Stock | 0.05% |
| Bond | 93.14% |
| Convertible | 0.00% |
| Preferred | 0.00% |
| Other | 2.90% |
Top 10 Holdings
| Name | % Weight | Price | % Change |
|---|---|---|---|
|
Fixed Income Clearing Corp Repo
|
3.59% | -- | -- |
|
Other Assets less Liabilities
|
2.90% | -- | -- |
| Argentine Republic ARGENT 4.125 07/09/2035 VAR USD Sovereign | 1.98% | 76.72 | 0.42% |
| Petroleos Mexicanos PEMEX 6.75 09/21/2047 FIX USD Corporate | 1.79% | 83.44 | 0.37% |
|
Brazil, Federative Republic of (Government) 10% 01-JAN-2035
|
1.60% | -- | -- |
|
Brazil, Federative Republic of (Government) 10% 01-JAN-2031
|
1.53% | -- | -- |
|
Mexico (United Mexican States) (Government) 10% 20-NOV-2036
|
1.33% | -- | -- |
| United Mexican States MEX 6.75 02/09/2056 FIX USD Sovereign | 1.28% | 96.80 | 0.06% |
|
Mexico (United Mexican States) (Government) 8.5% 02-MAR-2028
|
1.16% | -- | -- |
|
Peru, Republic of (Government) 7.6% 12-AUG-2039
|
1.07% | -- | -- |
Fees & Availability
| Fees | |
| Actual 12B-1 Fee | -- |
| Actual Management Fee | 0.63% |
| Administration Fee | -- |
| Maximum Front Load | -- |
| Maximum Deferred Load | -- |
| Maximum Redemption Fee | -- |
| General Availability | |
| Available for Insurance Product | No |
| Available for RRSP | No |
| Purchase Details | |
| Open to New Investors |
|
| Minimum Initial Investment | 0.00 None |
| Minimum Subsequent Investment | 0.00 None |
Basic Info
| Investment Strategy | |
| The Fund seeks to generate a high total return through a combination of capital appreciation and income. The Fund invests at least 80% of its net assets in debt securities of issuers located in emerging markets countries. |
| General | |
| Security Type | Mutual Fund |
| Equity Style | -- |
| Broad Asset Class | Taxable Bond |
| Broad Category | Fixed Income |
| Global Peer Group | Bond Emerging Markets Global HC |
| Peer Group | Emerging Mrkts Hard Currency Debt Funds |
| Global Macro | Bond Emerging Markets |
| US Macro | Emerging Markets Debt Funds |
| YCharts Categorization | -- |
| YCharts Benchmark | -- |
| Prospectus Objective | Emerging Mrkts Hard Currency Debt Funds |
| Fund Owner Firm Name | Transamerica |
| Broad Asset Class Benchmark Index | |
| ^BBUSATR | 100.0% |
Fundamentals
| General | |
| Distribution Yield | -- |
| Dividend Yield TTM (5-26-26) | 5.55% |
| 30-Day SEC Yield (4-30-26) | 7.40% |
| 7-Day SEC Yield | -- |
| Number of Holdings | 234 |
| Bond | |
| Yield to Maturity (3-31-26) | 7.94% |
| Effective Duration | 4.67 |
| Average Coupon | 7.91% |
| Calculated Average Quality | 4.850 |
| Effective Maturity | 10.38 |
| Nominal Maturity | 10.60 |
| Number of Bond Holdings | 189 |
As of March 31, 2026
Fund Details
Top Portfolio Holders
| Name | % Weight |
|---|---|
| Portfolio A | 5.00% |
| Portfolio B | 3.50% |
| Portfolio C | 2.25% |
Excel Add-In Codes
| Name: =YCI("M:TAEDX", "name") |
| Broad Asset Class: =YCI("M:TAEDX", "broad_asset_class") |
| Broad Category: =YCI("M:TAEDX", "broad_category_group") |
| Prospectus Objective: =YCI("M:TAEDX", "prospectus_objective") |
| To find the codes for any of our securities and financial metrics, see our Complete Excel Reference. |