

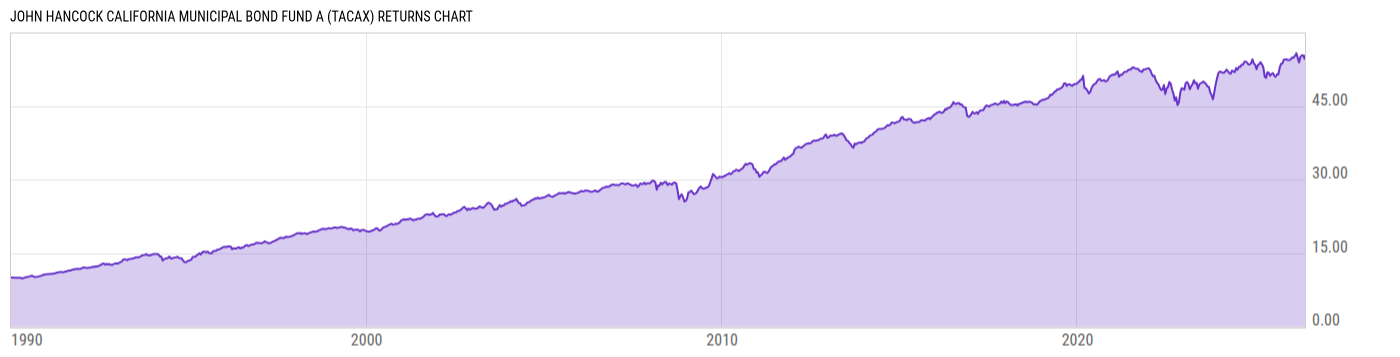
John Hancock California Municipal Bond Fund A (TACAX)
9.83
+0.04
(+0.41%)
USD |
May 27 2026
Returns Chart
Key Stats
| Net Expense Ratio | Total Assets Under Management | Weighted Average Dividend Yield | Turnover Ratio (Generic) |
|---|---|---|---|
| 0.72% | 540.62M | -- | 42.00% |
| 1 Year Fund Level Flows | 1 Year Total Returns (Daily) | Annualized Total Returns Since Inception (Daily) | Max Drawdown (Since Inception) |
| -9.854M | 7.10% |
Basic Info
| Investment Strategy | |
| The Fund seeks a high level of current income, consistent with preservation of capital, that is exempt from federal and California personal income taxes. The Fund invests, under normal circumstances, at least 80% of its net assets in securities of any maturity exempt from federal and California personal income taxes. |
| General | |
| Security Type | Mutual Fund |
| Equity Style | -- |
| Broad Asset Class | Municipal Bond |
| Broad Category | Fixed Income |
| Global Peer Group | Bond USD Municipal |
| Peer Group | California Municipal Debt Funds |
| Global Macro | Bond HC |
| US Macro | Single State Municipal Debt Funds |
| YCharts Categorization | -- |
| YCharts Benchmark | -- |
| Prospectus Objective | California Municipal Debt Funds |
| Fund Owner Firm Name | John Hancock Group |
| Broad Asset Class Benchmark Index | |
| ^BBMBTR | 100.0% |
Net Fund Flows Versus Peer Group
1 Month
% Rank:
55
-59.29M
Peer Group Low
167.22M
Peer Group High
1 Year
% Rank:
60
-9.854M
-167.69M
Peer Group Low
1.427B
Peer Group High
3 Months
% Rank:
50
-62.38M
Peer Group Low
514.40M
Peer Group High
3 Years
% Rank:
31
-1.835B
Peer Group Low
2.418B
Peer Group High
6 Months
% Rank:
60
-127.16M
Peer Group Low
998.45M
Peer Group High
5 Years
% Rank:
23
-3.876B
Peer Group Low
2.418B
Peer Group High
YTD
% Rank:
70
-60.55M
Peer Group Low
680.60M
Peer Group High
10 Years
% Rank:
55
-3.661B
Peer Group Low
3.402B
Peer Group High
Date Unavailable
Risk
Performance Versus Peer Group
Annual Total Returns Versus Peers
As of May 28, 2026.
Asset Allocation
As of March 31, 2026.
| Type | % Net |
|---|---|
| Cash | -0.07% |
| Stock | 0.00% |
| Bond | 98.76% |
| Convertible | 0.00% |
| Preferred | -0.17% |
| Other | 1.47% |
Top 10 Holdings
| Name | % Weight | Price | % Change |
|---|---|---|---|
|
John Hancock Collateral Trust
|
2.59% | -- | -- |
| SACRAMENTO CNTY CALIF ARPT SYS REV CA 5.000 07/01/2054 | 1.53% | 103.71 | 0.20% |
| CALIFORNIA CMNTY CHOICE FING AUTH CLEAN ENERGY PROJ REV CA 5.000 02/01/2055 | 1.35% | 106.14 | 0.12% |
| UNIVERSITY CALIF REVS CA 5.000 05/15/2041 | 1.34% | 110.08 | 0.13% |
| CALIFORNIA ST UNIV REV CA 5.250 11/01/2050 | 1.21% | 109.38 | 0.15% |
| LOS ANGELES CALIF DEPT WTR & PWR REV CA 5.000 07/01/2045 | 0.98% | 106.13 | 0.15% |
| CALIFORNIA HEALTH FACS FING AUTH REV CA 5.250 12/01/2049 | 0.98% | 105.73 | 0.13% |
| SAN FRANCISCO CALIF CITY & CNTY PUB UTILS COMMN WTR REV CA 4.000 11/01/2050 | 0.97% | 93.53 | 0.29% |
| GARDEN GROVE CALIF PUB FING AUTH LEASE REV CA 5.000 04/01/2049 | 0.96% | 105.26 | 0.13% |
| CALIFORNIA CMNTY CHOICE FING AUTH CLEAN ENERGY PROJ REV CA 5.000 11/01/2055 | 0.95% | 102.34 | 0.11% |
Fees & Availability
| Fees | |
| Actual 12B-1 Fee | 0.15% |
| Actual Management Fee | 0.36% |
| Administration Fee | -- |
| Maximum Front Load | 4.00% |
| Maximum Deferred Load | -- |
| Maximum Redemption Fee | -- |
| General Availability | |
| Available for Insurance Product | No |
| Available for RRSP | No |
| Purchase Details | |
| Open to New Investors |
|
| Minimum Initial Investment | 1000.00 None |
| Minimum Subsequent Investment | 0.00 None |
Basic Info
| Investment Strategy | |
| The Fund seeks a high level of current income, consistent with preservation of capital, that is exempt from federal and California personal income taxes. The Fund invests, under normal circumstances, at least 80% of its net assets in securities of any maturity exempt from federal and California personal income taxes. |
| General | |
| Security Type | Mutual Fund |
| Equity Style | -- |
| Broad Asset Class | Municipal Bond |
| Broad Category | Fixed Income |
| Global Peer Group | Bond USD Municipal |
| Peer Group | California Municipal Debt Funds |
| Global Macro | Bond HC |
| US Macro | Single State Municipal Debt Funds |
| YCharts Categorization | -- |
| YCharts Benchmark | -- |
| Prospectus Objective | California Municipal Debt Funds |
| Fund Owner Firm Name | John Hancock Group |
| Broad Asset Class Benchmark Index | |
| ^BBMBTR | 100.0% |
Fundamentals
| General | |
| Distribution Yield | -- |
| Dividend Yield TTM (5-26-26) | 3.83% |
| 30-Day SEC Yield (4-30-26) | 3.67% |
| 7-Day SEC Yield | -- |
| Number of Holdings | 426 |
| Bond | |
| Yield to Maturity (3-31-26) | 4.47% |
| Effective Duration | 9.02 |
| Average Coupon | 4.79% |
| Calculated Average Quality | 2.704 |
| Effective Maturity | 18.62 |
| Nominal Maturity | 21.21 |
| Number of Bond Holdings | 414 |
As of March 31, 2026
Fund Details
Top Portfolio Holders
| Name | % Weight |
|---|---|
| Portfolio A | 5.00% |
| Portfolio B | 3.50% |
| Portfolio C | 2.25% |
Excel Add-In Codes
| Name: =YCI("M:TACAX", "name") |
| Broad Asset Class: =YCI("M:TACAX", "broad_asset_class") |
| Broad Category: =YCI("M:TACAX", "broad_category_group") |
| Prospectus Objective: =YCI("M:TACAX", "prospectus_objective") |
| To find the codes for any of our securities and financial metrics, see our Complete Excel Reference. |