

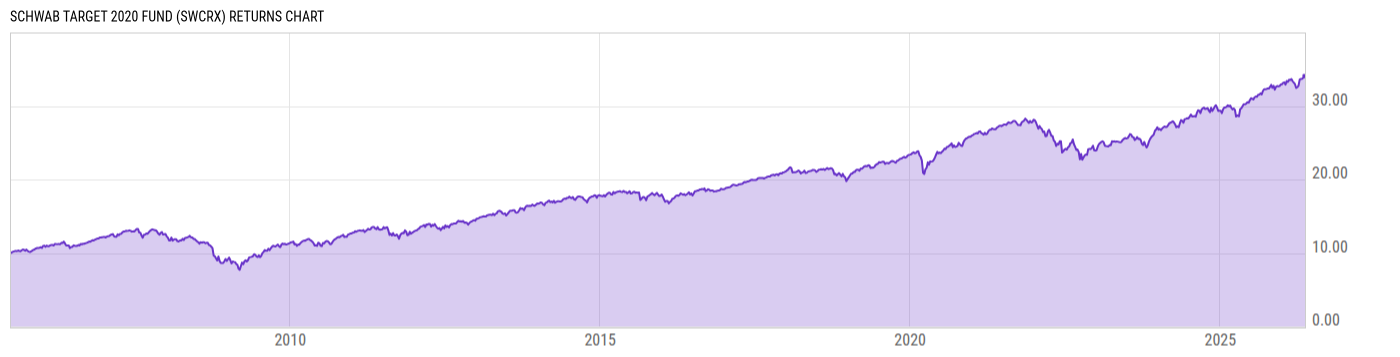
Schwab Target 2020 Fund (SWCRX)
13.39
+0.02
(+0.15%)
USD |
Jun 09 2026
Returns Chart
Key Stats
| Net Expense Ratio | Total Assets Under Management | Weighted Average Dividend Yield | Turnover Ratio (Generic) |
|---|---|---|---|
| 0.28% | 276.86M | -- | 9.00% |
| 1 Year Fund Level Flows | 1 Year Total Returns (Daily) | Annualized Total Returns Since Inception (Daily) | Max Drawdown (Since Inception) |
| -52.11M | 11.91% |
Basic Info
| Investment Strategy | |
| The Fund seeks to provide capital appreciation and income consistent with its current asset allocation. The Fund invests in the underlying funds in accordance with its target portfolio allocation. These underlying funds invest their assets directly in equity, fixed income, cash and cash equivalents. |
| General | |
| Security Type | Mutual Fund |
| Equity Style | -- |
| Broad Asset Class | Allocation |
| Broad Category | Allocation |
| Global Peer Group | Target Maturity MA USD 2020 |
| Peer Group | Mixed-Asset Target 2020 Funds |
| Global Macro | Target Maturity |
| US Macro | Mixed-Assets Target Date Funds |
| YCharts Categorization | -- |
| YCharts Benchmark | -- |
| Prospectus Objective | Income Funds |
| Fund Owner Firm Name | Charles Schwab |
| Broad Asset Class Benchmark Index | |
| ^SPXTR | 100.0% |
Net Fund Flows Versus Peer Group
1 Month
% Rank:
60
-513.38M
Peer Group Low
56.52M
Peer Group High
1 Year
% Rank:
48
-52.11M
-4.737B
Peer Group Low
216.16M
Peer Group High
3 Months
% Rank:
54
-1.247B
Peer Group Low
110.09M
Peer Group High
3 Years
% Rank:
50
-16.15B
Peer Group Low
415.28M
Peer Group High
6 Months
% Rank:
51
-2.360B
Peer Group Low
155.63M
Peer Group High
5 Years
% Rank:
51
-30.51B
Peer Group Low
484.40M
Peer Group High
YTD
% Rank:
54
-2.115B
Peer Group Low
134.74M
Peer Group High
10 Years
% Rank:
59
-42.92B
Peer Group Low
865.73M
Peer Group High
Date Unavailable
Risk
Performance Versus Peer Group
Annual Total Returns Versus Peers
As of June 10, 2026.
Asset Allocation
As of April 30, 2026.
| Type | % Net |
|---|---|
| Cash | 1.96% |
| Stock | 41.23% |
| Bond | 56.19% |
| Convertible | 0.00% |
| Preferred | 0.03% |
| Other | 0.59% |
Top 10 Holdings
| Name | % Weight | Price | % Change |
|---|---|---|---|
| Schwab US Aggregate Bond Index Fund | 24.34% | 8.87 | 0.11% |
| Schwab S&P 500 Index Fund | 13.94% | 19.02 | -0.26% |
| Baird Aggregate Bond Fund Institutional | 12.26% | 9.79 | 0.20% |
| Schwab Short-Term Bond Index Fund | 7.18% | 9.55 | 0.10% |
| Schwab Treasury Inflation Protected Sec Index Fund | 6.11% | 10.39 | 0.10% |
| Schwab International Opportunities Fund | 5.19% | 26.24 | 0.15% |
| Schwab Select Large Cap Growth Fund | 4.19% | 26.85 | -0.67% |
| Schwab International Core Equity Fund | 4.07% | 16.39 | 0.06% |
| Dodge & Cox Stock Fund I | 2.91% | 17.12 | 1.18% |
| Allspring Core Plus Bond Fund R6 | 2.60% | 11.15 | 0.27% |
Fees & Availability
| Fees | |
| Actual 12B-1 Fee | -- |
| Actual Management Fee | -- |
| Administration Fee | -- |
| Maximum Front Load | -- |
| Maximum Deferred Load | -- |
| Maximum Redemption Fee | 0.00% |
| General Availability | |
| Available for Insurance Product | No |
| Available for RRSP | No |
| Purchase Details | |
| Open to New Investors |
|
| Minimum Initial Investment | 0.00 None |
| Minimum Subsequent Investment | 0.00 None |
Basic Info
| Investment Strategy | |
| The Fund seeks to provide capital appreciation and income consistent with its current asset allocation. The Fund invests in the underlying funds in accordance with its target portfolio allocation. These underlying funds invest their assets directly in equity, fixed income, cash and cash equivalents. |
| General | |
| Security Type | Mutual Fund |
| Equity Style | -- |
| Broad Asset Class | Allocation |
| Broad Category | Allocation |
| Global Peer Group | Target Maturity MA USD 2020 |
| Peer Group | Mixed-Asset Target 2020 Funds |
| Global Macro | Target Maturity |
| US Macro | Mixed-Assets Target Date Funds |
| YCharts Categorization | -- |
| YCharts Benchmark | -- |
| Prospectus Objective | Income Funds |
| Fund Owner Firm Name | Charles Schwab |
| Broad Asset Class Benchmark Index | |
| ^SPXTR | 100.0% |
Fundamentals
| General | |
| Distribution Yield | -- |
| Dividend Yield TTM (6-8-26) | 3.19% |
| 30-Day SEC Yield | -- |
| 7-Day SEC Yield | -- |
| Number of Holdings | 22 |
| Stock | |
| Weighted Average PE Ratio | 28.47 |
| Weighted Average Price to Sales Ratio | 6.547 |
| Weighted Average Price to Book Ratio | 8.335 |
| Weighted Median ROE | 62.29% |
| Weighted Median ROA | 13.13% |
| ROI (TTM) | 19.21% |
| Return on Investment (TTM) | 19.21% |
| Earning Yield | 0.0474 |
| LT Debt / Shareholders Equity | 0.7529 |
| Number of Equity Holdings | 0 |
| Bond | |
| Yield to Maturity (4-30-26) | 4.20% |
| Effective Duration | -- |
| Average Coupon | 3.57% |
| Calculated Average Quality | 2.358 |
| Effective Maturity | 11.51 |
| Nominal Maturity | 11.58 |
| Number of Bond Holdings | 0 |
As of April 30, 2026
Growth Metrics
| EPS Growth (1Y) | 24.36% |
| EPS Growth (3Y) | 17.51% |
| EPS Growth (5Y) | 22.28% |
| Sales Growth (1Y) | 13.55% |
| Sales Growth (3Y) | 12.97% |
| Sales Growth (5Y) | 14.44% |
| Sales per Share Growth (1Y) | 25.07% |
| Sales per Share Growth (3Y) | 13.42% |
| Operating Cash Flow - Growth Rate (3Y) | 23.84% |
As of April 30, 2026
Fund Details
| Key Dates | |
| Inception Date | 7/1/2005 |
| Last Annual Report Date | 10/31/2025 |
| Last Prospectus Date | 2/24/2026 |
| Attributes | |
| Index Fund | -- |
| Inverse Fund | No |
| Leveraged Fund | -- |
| Fund of Funds |
|
| Currency Hedged Fund | -- |
| Socially Responsible Fund | No |
Top Portfolio Holders
| Name | % Weight |
|---|---|
| Portfolio A | 5.00% |
| Portfolio B | 3.50% |
| Portfolio C | 2.25% |
Excel Add-In Codes
| Name: =YCI("M:SWCRX", "name") |
| Broad Asset Class: =YCI("M:SWCRX", "broad_asset_class") |
| Broad Category: =YCI("M:SWCRX", "broad_category_group") |
| Prospectus Objective: =YCI("M:SWCRX", "prospectus_objective") |
| To find the codes for any of our securities and financial metrics, see our Complete Excel Reference. |