

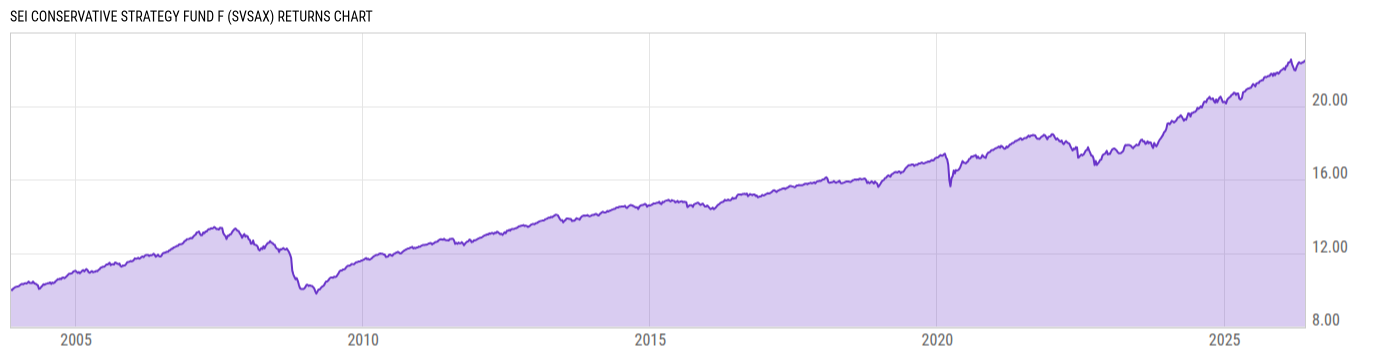
SEI Conservative Strategy Fund F (SVSAX)
10.93
-0.01
(-0.09%)
USD |
May 27 2026
Returns Chart
Key Stats
| Net Expense Ratio | Total Assets Under Management | Weighted Average Dividend Yield | Turnover Ratio (Generic) |
|---|---|---|---|
| 1.20% | 28.00M | -- | 13.00% |
| 1 Year Fund Level Flows | 1 Year Total Returns (Daily) | Annualized Total Returns Since Inception (Daily) | Max Drawdown (Since Inception) |
| -4.146M | 7.21% |
Basic Info
| Investment Strategy | |
| The Fund seeks to manage the risk of loss while providing the opportunity for modest capital appreciation. The Fund invests in other SEI Funds that invest primarily in U.S. short-term investment grade fixed income securities. The Fund will also invest to a lesser extent in other asset types through other SEI funds. |
| General | |
| Security Type | Mutual Fund |
| Equity Style | -- |
| Broad Asset Class | Allocation |
| Broad Category | Allocation |
| Global Peer Group | Mixed Asset USD Conservative |
| Peer Group | Mixed-Asset Target Alloc Consv Funds |
| Global Macro | Mixed Asset HC Conservative |
| US Macro | Mixed-Assets Target Allocation Funds |
| YCharts Categorization | -- |
| YCharts Benchmark | -- |
| Prospectus Objective | Income Funds |
| Fund Owner Firm Name | SEI |
| Broad Asset Class Benchmark Index | |
| ^SPXTR | 100.0% |
Net Fund Flows Versus Peer Group
1 Month
% Rank:
17
-107.45M
Peer Group Low
159.88M
Peer Group High
1 Year
% Rank:
23
-4.146M
-4.581B
Peer Group Low
630.01M
Peer Group High
3 Months
% Rank:
25
-729.32M
Peer Group Low
641.72M
Peer Group High
3 Years
% Rank:
22
-18.96B
Peer Group Low
595.73M
Peer Group High
6 Months
% Rank:
27
-2.089B
Peer Group Low
639.77M
Peer Group High
5 Years
% Rank:
24
-24.82B
Peer Group Low
591.52M
Peer Group High
YTD
% Rank:
25
-1.180B
Peer Group Low
642.54M
Peer Group High
10 Years
% Rank:
35
-23.81B
Peer Group Low
1.099B
Peer Group High
Date Unavailable
Risk
Performance Versus Peer Group
Annual Total Returns Versus Peers
As of May 28, 2026.
Asset Allocation
As of April 30, 2026.
| Type | % Net |
|---|---|
| Cash | 22.70% |
| Stock | 26.58% |
| Bond | 50.02% |
| Convertible | 0.00% |
| Preferred | 0.09% |
| Other | 0.61% |
Top 10 Holdings
| Name | % Weight | Price | % Change |
|---|---|---|---|
| SEI Inst Mgd Multi-Asset Capital Stability Fund Y | 17.25% | 10.41 | 0.00% |
| SEI Inst Mgd Core Fixed Income Fund Y | 15.26% | 9.54 | 0.00% |
| SEI Short-Duration Government Fund Y | 14.21% | 10.17 | 0.00% |
| SEI Inst Mgd Global Managed Volatility Fund Y | 9.99% | 10.96 | -0.27% |
| SEI Inst Mgd Conservative Income Fund Y | 9.98% | 10.01 | 0.00% |
| SEI Inst Mgd Multi-Asset Income Fund Y | 5.28% | 10.38 | 0.10% |
| SEI Inst Mgd Multi-Asset Infl Managed Fund Y | 5.02% | 8.51 | -0.47% |
| SEI Inst Mgd Real Return Fund Y | 3.99% | 9.87 | 0.00% |
| SEI Ultra Short Duration Bond Fund Y | 3.99% | 9.34 | 0.00% |
| SEI DBi Multi-Strategy Alternative ETF | 3.01% | 26.17 | -0.13% |
Fees & Availability
| Fees | |
| Actual 12B-1 Fee | -- |
| Actual Management Fee | 0.10% |
| Administration Fee | -- |
| Maximum Front Load | -- |
| Maximum Deferred Load | -- |
| Maximum Redemption Fee | -- |
| General Availability | |
| Available for Insurance Product | No |
| Available for RRSP | No |
| Purchase Details | |
| Open to New Investors |
|
| Minimum Initial Investment | 100000.0 None |
| Minimum Subsequent Investment | 1000.00 None |
Basic Info
| Investment Strategy | |
| The Fund seeks to manage the risk of loss while providing the opportunity for modest capital appreciation. The Fund invests in other SEI Funds that invest primarily in U.S. short-term investment grade fixed income securities. The Fund will also invest to a lesser extent in other asset types through other SEI funds. |
| General | |
| Security Type | Mutual Fund |
| Equity Style | -- |
| Broad Asset Class | Allocation |
| Broad Category | Allocation |
| Global Peer Group | Mixed Asset USD Conservative |
| Peer Group | Mixed-Asset Target Alloc Consv Funds |
| Global Macro | Mixed Asset HC Conservative |
| US Macro | Mixed-Assets Target Allocation Funds |
| YCharts Categorization | -- |
| YCharts Benchmark | -- |
| Prospectus Objective | Income Funds |
| Fund Owner Firm Name | SEI |
| Broad Asset Class Benchmark Index | |
| ^SPXTR | 100.0% |
Fundamentals
| General | |
| Distribution Yield | -- |
| Dividend Yield TTM (5-26-26) | 3.19% |
| 30-Day SEC Yield (3-31-26) | 0.00% |
| 7-Day SEC Yield | -- |
| Number of Holdings | 16 |
| Stock | |
| Weighted Average PE Ratio | 26.84 |
| Weighted Average Price to Sales Ratio | 7.842 |
| Weighted Average Price to Book Ratio | 9.299 |
| Weighted Median ROE | 97.56% |
| Weighted Median ROA | 20.21% |
| ROI (TTM) | 28.02% |
| Return on Investment (TTM) | 28.02% |
| Earning Yield | 0.0461 |
| LT Debt / Shareholders Equity | 0.7775 |
| Number of Equity Holdings | 0 |
| Bond | |
| Yield to Maturity (4-30-26) | 3.92% |
| Effective Duration | -- |
| Average Coupon | 3.64% |
| Calculated Average Quality | 2.333 |
| Effective Maturity | 10.95 |
| Nominal Maturity | 11.03 |
| Number of Bond Holdings | 0 |
As of April 30, 2026
Growth Metrics
| EPS Growth (1Y) | 27.91% |
| EPS Growth (3Y) | 23.23% |
| EPS Growth (5Y) | 27.36% |
| Sales Growth (1Y) | 16.09% |
| Sales Growth (3Y) | 19.19% |
| Sales Growth (5Y) | 17.56% |
| Sales per Share Growth (1Y) | 20.37% |
| Sales per Share Growth (3Y) | 19.81% |
| Operating Cash Flow - Growth Rate (3Y) | 31.24% |
As of April 30, 2026
Top Portfolio Holders
| Name | % Weight |
|---|---|
| Portfolio A | 5.00% |
| Portfolio B | 3.50% |
| Portfolio C | 2.25% |
Excel Add-In Codes
| Name: =YCI("M:SVSAX", "name") |
| Broad Asset Class: =YCI("M:SVSAX", "broad_asset_class") |
| Broad Category: =YCI("M:SVSAX", "broad_category_group") |
| Prospectus Objective: =YCI("M:SVSAX", "prospectus_objective") |
| To find the codes for any of our securities and financial metrics, see our Complete Excel Reference. |