

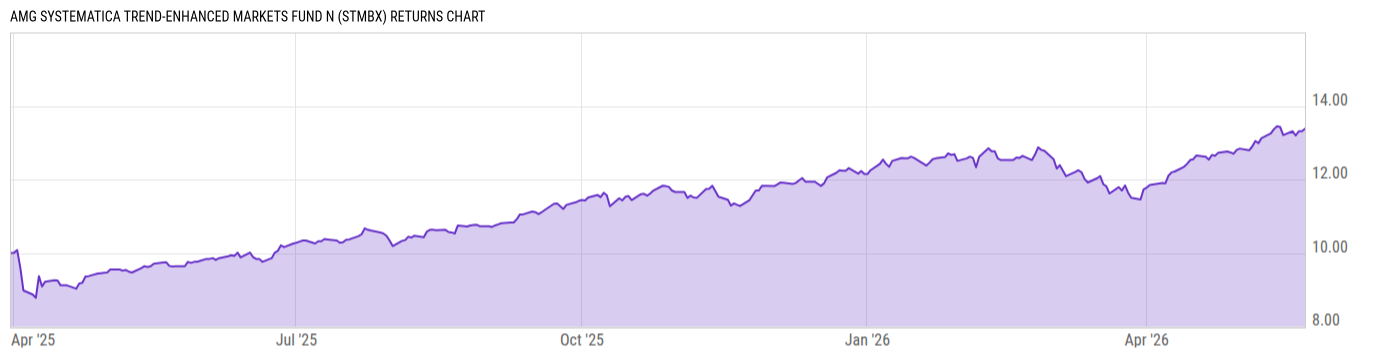
AMG Systematica Trend-Enhanced Markets Fund N (STMBX)
11.41
-0.04
(-0.35%)
USD |
Jun 09 2026
Returns Chart
Key Stats
| Net Expense Ratio | Total Assets Under Management | Weighted Average Dividend Yield | Turnover Ratio (Generic) |
|---|---|---|---|
| 1.52% | 7.891M | -- | 0.10% |
| 1 Year Fund Level Flows | 1 Year Total Returns (Daily) | Annualized Total Returns Since Inception (Daily) | Max Drawdown (Since Inception) |
| -276.00 | 32.71% |
Basic Info
| Investment Strategy | |
| The Fund seeks long-term capital appreciation. The Fund seeks to achieve its investment objective by allocating its assets between Trend Following Component and Strategic Long U.S. Equity Component. The Fund generally seeks to gain exposure to major asset classes by investing in derivative instruments. |
| General | |
| Security Type | Mutual Fund |
| Equity Style | -- |
| Broad Asset Class | Alternative |
| Broad Category | Alternative Strategies |
| Global Peer Group | Alternative Global Macro |
| Peer Group | Alternative Global Macro Funds |
| Global Macro | Liquid Alternatives |
| US Macro | Alternative Equity Funds |
| YCharts Categorization | -- |
| YCharts Benchmark | -- |
| Prospectus Objective | Alternative Global Macro Funds |
| Fund Owner Firm Name | AMG |
| Broad Asset Class Benchmark Index | |
| ^MSACWINTR | 100.0% |
Net Fund Flows Versus Peer Group
1 Month
% Rank:
41
-32.29M
Peer Group Low
445.62M
Peer Group High
1 Year
% Rank:
54
-276.00
-2.362B
Peer Group Low
2.464B
Peer Group High
3 Months
% Rank:
35
-65.51M
Peer Group Low
885.16M
Peer Group High
3 Years
% Rank:
42
-6.710B
Peer Group Low
3.190B
Peer Group High
6 Months
% Rank:
48
-289.08M
Peer Group Low
1.556B
Peer Group High
5 Years
% Rank:
40
-8.867B
Peer Group Low
3.112B
Peer Group High
YTD
% Rank:
47
-129.84M
Peer Group Low
1.443B
Peer Group High
10 Years
% Rank:
39
-17.87B
Peer Group Low
3.792B
Peer Group High
Date Unavailable
Risk
Performance Versus Peer Group
Annual Total Returns Versus Peers
As of June 10, 2026.
Asset Allocation
As of December 31, 2025.
| Type | % Net |
|---|---|
| Cash | 100.6% |
| Stock | 0.00% |
| Bond | 0.00% |
| Convertible | 0.00% |
| Preferred | 0.00% |
| Other | -0.64% |
Top 10 Holdings
| Name | % Weight | Price | % Change |
|---|---|---|---|
|
Fixed Income Clearing Corp Repo
|
55.24% | -- | -- |
|
USD Cash
|
39.51% | -- | -- |
|
CNH/USD Forward Contract
|
16.49% | -- | -- |
|
USD/JPY Forward Contract
|
13.86% | -- | -- |
|
MXN/USD Forward Contract
|
12.33% | -- | -- |
|
USD/INR Forward Contract
|
9.64% | -- | -- |
|
HUF/USD Forward Contract
|
8.26% | -- | -- |
|
USD/TWD Forward Contract
|
6.92% | -- | -- |
|
ZAR/USD Forward Contract
|
6.87% | -- | -- |
|
PLN/USD Forward Contract
|
6.86% | -- | -- |
Fees & Availability
| Fees | |
| Actual 12B-1 Fee | 0.25% |
| Actual Management Fee | -- |
| Administration Fee | 37.00% |
| Maximum Front Load | -- |
| Maximum Deferred Load | -- |
| Maximum Redemption Fee | -- |
| General Availability | |
| Available for Insurance Product | -- |
| Available for RRSP | -- |
| Purchase Details | |
| Open to New Investors |
|
| Minimum Initial Investment | 2000.00 None |
| Minimum Subsequent Investment | 100.00 None |
Basic Info
| Investment Strategy | |
| The Fund seeks long-term capital appreciation. The Fund seeks to achieve its investment objective by allocating its assets between Trend Following Component and Strategic Long U.S. Equity Component. The Fund generally seeks to gain exposure to major asset classes by investing in derivative instruments. |
| General | |
| Security Type | Mutual Fund |
| Equity Style | -- |
| Broad Asset Class | Alternative |
| Broad Category | Alternative Strategies |
| Global Peer Group | Alternative Global Macro |
| Peer Group | Alternative Global Macro Funds |
| Global Macro | Liquid Alternatives |
| US Macro | Alternative Equity Funds |
| YCharts Categorization | -- |
| YCharts Benchmark | -- |
| Prospectus Objective | Alternative Global Macro Funds |
| Fund Owner Firm Name | AMG |
| Broad Asset Class Benchmark Index | |
| ^MSACWINTR | 100.0% |
Fundamentals
| General | |
| Distribution Yield | -- |
| Dividend Yield TTM (6-8-26) | 2.72% |
| 30-Day SEC Yield | -- |
| 7-Day SEC Yield | -- |
| Number of Holdings | 110 |
Top Portfolio Holders
| Name | % Weight |
|---|---|
| Portfolio A | 5.00% |
| Portfolio B | 3.50% |
| Portfolio C | 2.25% |
Excel Add-In Codes
| Name: =YCI("M:STMBX", "name") |
| Broad Asset Class: =YCI("M:STMBX", "broad_asset_class") |
| Broad Category: =YCI("M:STMBX", "broad_category_group") |
| Prospectus Objective: =YCI("M:STMBX", "prospectus_objective") |
| To find the codes for any of our securities and financial metrics, see our Complete Excel Reference. |