

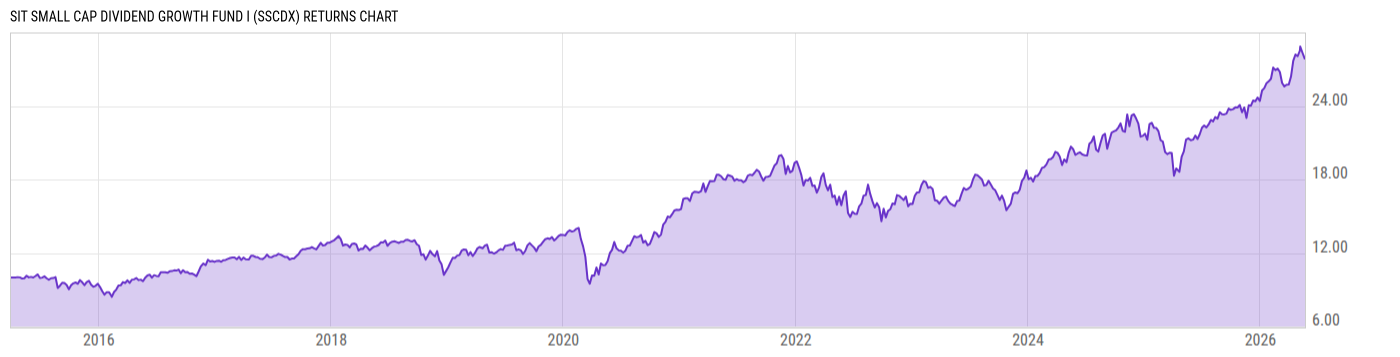
Sit Small Cap Dividend Growth Fund I (SSCDX)
21.70
+0.13
(+0.60%)
USD |
Jun 09 2026
Returns Chart
Key Stats
| Net Expense Ratio | Total Assets Under Management | Weighted Average Dividend Yield | Turnover Ratio (Generic) |
|---|---|---|---|
| 0.88% | 51.61M | 1.71% | 12.00% |
| 1 Year Fund Level Flows | 1 Year Total Returns (Daily) | Annualized Total Returns Since Inception (Daily) | Max Drawdown (Since Inception) |
| 720766.0 | 29.92% |
Basic Info
| Investment Strategy | |
| The Fund seeks to provide current income that exceeds the Funds benchmark index and that grows over a period of years. Secondarily the Fund seeks long-term capital appreciation. The Fund seeks to achieve its objectives by investing at least 80% of its net assets in small cap dividend-paying common stocks. |
| General | |
| Security Type | Mutual Fund |
| Equity Style | Small Cap Core |
| Broad Asset Class | US Equity |
| Broad Category | Equity |
| Global Peer Group | Equity US Sm&Mid Cap |
| Peer Group | Small-Cap Core Funds |
| Global Macro | Equity North America |
| US Macro | Small-Cap Funds |
| YCharts Categorization | -- |
| YCharts Benchmark | -- |
| Prospectus Objective | Small-Cap Funds |
| Fund Owner Firm Name | Sit Mutual Funds |
| Broad Asset Class Benchmark Index | |
| ^SPXTR | 100.0% |
Net Fund Flows Versus Peer Group
1 Month
% Rank:
34
-1.408B
Peer Group Low
769.95M
Peer Group High
1 Year
% Rank:
21
720766.0
-7.752B
Peer Group Low
2.189B
Peer Group High
3 Months
% Rank:
40
-1.690B
Peer Group Low
933.62M
Peer Group High
3 Years
% Rank:
24
-4.427B
Peer Group Low
6.105B
Peer Group High
6 Months
% Rank:
31
-3.555B
Peer Group Low
1.954B
Peer Group High
5 Years
% Rank:
27
-8.891B
Peer Group Low
7.897B
Peer Group High
YTD
% Rank:
33
-5.360B
Peer Group Low
1.730B
Peer Group High
10 Years
% Rank:
30
-10.79B
Peer Group Low
29.63B
Peer Group High
Date Unavailable
Risk
Performance Versus Peer Group
Annual Total Returns Versus Peers
As of June 10, 2026.
Asset Allocation
As of December 31, 2025.
| Type | % Net |
|---|---|
| Cash | 1.93% |
| Stock | 95.50% |
| Bond | 2.57% |
| Convertible | 0.00% |
| Preferred | 0.00% |
| Other | 0.00% |
Top 10 Holdings
| Name | % Weight | Price | % Change |
|---|---|---|---|
| Fidelity Instl Government Portfolio I | 4.50% | 1.00 | 0.00% |
| Argan, Inc. | 3.94% | 613.93 | -0.98% |
| EMCOR Group, Inc. | 2.59% | 827.78 | 0.48% |
| Monolithic Power Systems, Inc. | 2.18% | 1531.98 | -1.74% |
| TechnipFMC plc | 1.99% | 68.39 | -0.52% |
| Flowserve Corp. | 1.98% | 75.97 | 1.48% |
| Coherent Corp. | 1.89% | 355.94 | -11.44% |
| Evercore, Inc. | 1.80% | 357.11 | 4.99% |
|
Cadence Bank ORD
|
1.67% | -- | -- |
| Old National Bancorp | 1.66% | 24.28 | 2.06% |
Fees & Availability
| Fees | |
| Actual 12B-1 Fee | -- |
| Actual Management Fee | 0.85% |
| Administration Fee | -- |
| Maximum Front Load | -- |
| Maximum Deferred Load | -- |
| Maximum Redemption Fee | 2.00% |
| General Availability | |
| Available for Insurance Product | No |
| Available for RRSP | No |
| Purchase Details | |
| Open to New Investors |
|
| Minimum Initial Investment | 100000.0 None |
| Minimum Subsequent Investment | 100.00 None |
Basic Info
| Investment Strategy | |
| The Fund seeks to provide current income that exceeds the Funds benchmark index and that grows over a period of years. Secondarily the Fund seeks long-term capital appreciation. The Fund seeks to achieve its objectives by investing at least 80% of its net assets in small cap dividend-paying common stocks. |
| General | |
| Security Type | Mutual Fund |
| Equity Style | Small Cap Core |
| Broad Asset Class | US Equity |
| Broad Category | Equity |
| Global Peer Group | Equity US Sm&Mid Cap |
| Peer Group | Small-Cap Core Funds |
| Global Macro | Equity North America |
| US Macro | Small-Cap Funds |
| YCharts Categorization | -- |
| YCharts Benchmark | -- |
| Prospectus Objective | Small-Cap Funds |
| Fund Owner Firm Name | Sit Mutual Funds |
| Broad Asset Class Benchmark Index | |
| ^SPXTR | 100.0% |
Fundamentals
| General | |
| Distribution Yield | -- |
| Dividend Yield TTM (6-8-26) | 0.79% |
| 30-Day SEC Yield | -- |
| 7-Day SEC Yield | -- |
| Number of Holdings | 92 |
| Stock | |
| Weighted Average PE Ratio | 27.13 |
| Weighted Average Price to Sales Ratio | 4.589 |
| Weighted Average Price to Book Ratio | 4.172 |
| Weighted Median ROE | 16.06% |
| Weighted Median ROA | 6.81% |
| ROI (TTM) | 11.34% |
| Return on Investment (TTM) | 11.34% |
| Earning Yield | 0.0497 |
| LT Debt / Shareholders Equity | 0.7295 |
| Number of Equity Holdings | 91 |
As of December 31, 2025
Growth Metrics
| EPS Growth (1Y) | 36.04% |
| EPS Growth (3Y) | 10.29% |
| EPS Growth (5Y) | 9.55% |
| Sales Growth (1Y) | 13.03% |
| Sales Growth (3Y) | 11.47% |
| Sales Growth (5Y) | 11.69% |
| Sales per Share Growth (1Y) | 10.37% |
| Sales per Share Growth (3Y) | 9.43% |
| Operating Cash Flow - Growth Rate (3Y) | 12.62% |
As of December 31, 2025
Fund Details
| Key Dates | |
| Inception Date | 3/31/2015 |
| Last Annual Report Date | 6/30/2025 |
| Last Prospectus Date | 3/1/2025 |
| Share Classes | |
| SDFSX | S |
| Attributes | |
| Index Fund | -- |
| Inverse Fund | No |
| Leveraged Fund | -- |
| Fund of Funds | No |
| Currency Hedged Fund | -- |
| Socially Responsible Fund | No |
Top Portfolio Holders
| Name | % Weight |
|---|---|
| Portfolio A | 5.00% |
| Portfolio B | 3.50% |
| Portfolio C | 2.25% |
Excel Add-In Codes
| Name: =YCI("M:SSCDX", "name") |
| Broad Asset Class: =YCI("M:SSCDX", "broad_asset_class") |
| Broad Category: =YCI("M:SSCDX", "broad_category_group") |
| Prospectus Objective: =YCI("M:SSCDX", "prospectus_objective") |
| To find the codes for any of our securities and financial metrics, see our Complete Excel Reference. |