

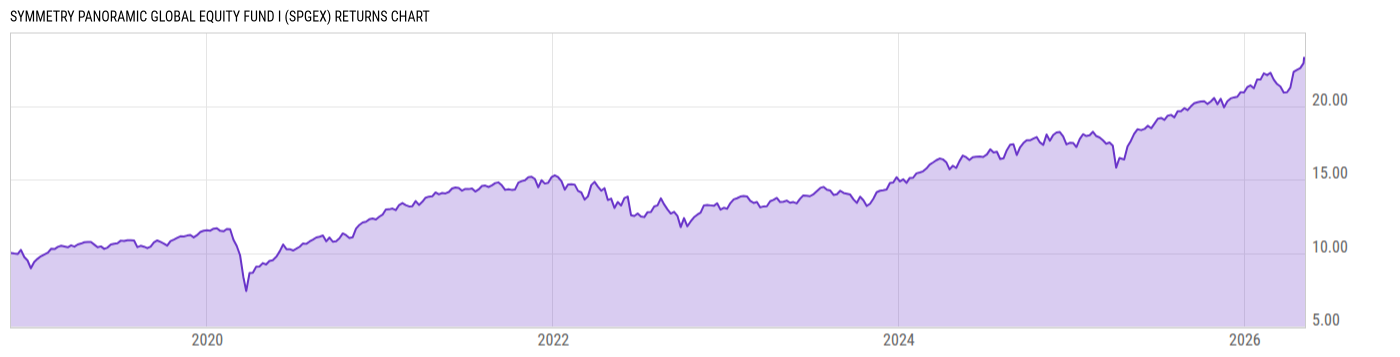
Symmetry Panoramic Global Equity Fund I (SPGEX)
15.37
+0.11
(+0.72%)
USD |
May 08 2026
Returns Chart
Key Stats
| Net Expense Ratio | Total Assets Under Management | Weighted Average Dividend Yield | Turnover Ratio (Generic) |
|---|---|---|---|
| 0.77% | 408.65M | 1.54% | 21.00% |
| 1 Year Fund Level Flows | 1 Year Total Returns (Daily) | Annualized Total Returns Since Inception (Daily) | Max Drawdown (Since Inception) |
| -72.00M | 31.31% |
Basic Info
| Investment Strategy | |
| The Fund seeks long-term capital appreciation. The Fund invests, directly or indirectly, at least 80% of its net assets in equity securities of U.S. and foreign companies. The Fund does not target a specific market capitalization and may invest in Underlying Funds focusing on different segments of the equity markets. |
| General | |
| Security Type | Mutual Fund |
| Equity Style | Multi Cap Value |
| Broad Asset Class | International Equity |
| Broad Category | Equity |
| Global Peer Group | Equity Global |
| Peer Group | Global Multi-Cap Core |
| Global Macro | Equity Global |
| US Macro | Developed Global Markets Funds |
| YCharts Categorization | -- |
| YCharts Benchmark | -- |
| Prospectus Objective | Global Funds |
| Fund Owner Firm Name | Symmetry Panoramic |
| Broad Asset Class Benchmark Index | |
| ^MSACXUSNTR | 100.0% |
Net Fund Flows Versus Peer Group
1 Month
% Rank:
66
-2.171B
Peer Group Low
3.434B
Peer Group High
1 Year
% Rank:
72
-72.00M
-14.97B
Peer Group Low
15.48B
Peer Group High
3 Months
% Rank:
74
-3.636B
Peer Group Low
6.174B
Peer Group High
3 Years
% Rank:
72
-38.30B
Peer Group Low
25.70B
Peer Group High
6 Months
% Rank:
74
-7.938B
Peer Group Low
10.49B
Peer Group High
5 Years
% Rank:
75
-57.79B
Peer Group Low
35.30B
Peer Group High
YTD
% Rank:
77
-4.724B
Peer Group Low
7.847B
Peer Group High
10 Years
% Rank:
63
-114.40B
Peer Group Low
45.60B
Peer Group High
Date Unavailable
Risk
Performance Versus Peer Group
Annual Total Returns Versus Peers
As of May 11, 2026.
Asset Allocation
As of December 31, 2025.
| Type | % Net |
|---|---|
| Cash | 1.17% |
| Stock | 98.77% |
| Bond | 1.25% |
| Convertible | 0.00% |
| Preferred | 0.10% |
| Other | -1.29% |
Top 10 Holdings
| Name | % Weight | Price | % Change |
|---|---|---|---|
| DFA Dimensional US Targeted Value ETF | 3.61% | 67.25 | 0.51% |
| DFA Large Cap International Portfolio Inst | 3.25% | 37.95 | 0.88% |
| DFA Real Estate Securities Portfolio Institutional | 2.81% | 44.89 | 0.38% |
| iShares MSCI USA Momentum Factor ETF | 2.38% | 301.80 | 2.68% |
| DFA International Small Cap Value Portfolio Inst | 2.02% | 34.22 | 0.88% |
| DFA International Value Portfolio Institutional | 1.94% | 31.79 | 0.76% |
| Avantis US Small Cap Value ETF | 1.90% | 119.84 | 0.55% |
| Microsoft Corp. | 1.82% | 415.12 | -1.34% |
| Vanguard US Value Factor ETF | 1.78% | 144.62 | 0.21% |
| DFA Internatnl Hi Relative Profitability Ptfl Inst | 1.77% | 16.57 | 1.10% |
Fees & Availability
| Fees | |
| Actual 12B-1 Fee | -- |
| Actual Management Fee | 0.44% |
| Administration Fee | 114.2K% |
| Maximum Front Load | -- |
| Maximum Deferred Load | -- |
| Maximum Redemption Fee | -- |
| General Availability | |
| Available for Insurance Product | No |
| Available for RRSP | No |
| Purchase Details | |
| Open to New Investors |
|
| Minimum Initial Investment | 1000.00 None |
| Minimum Subsequent Investment | 100.00 None |
Basic Info
| Investment Strategy | |
| The Fund seeks long-term capital appreciation. The Fund invests, directly or indirectly, at least 80% of its net assets in equity securities of U.S. and foreign companies. The Fund does not target a specific market capitalization and may invest in Underlying Funds focusing on different segments of the equity markets. |
| General | |
| Security Type | Mutual Fund |
| Equity Style | Multi Cap Value |
| Broad Asset Class | International Equity |
| Broad Category | Equity |
| Global Peer Group | Equity Global |
| Peer Group | Global Multi-Cap Core |
| Global Macro | Equity Global |
| US Macro | Developed Global Markets Funds |
| YCharts Categorization | -- |
| YCharts Benchmark | -- |
| Prospectus Objective | Global Funds |
| Fund Owner Firm Name | Symmetry Panoramic |
| Broad Asset Class Benchmark Index | |
| ^MSACXUSNTR | 100.0% |
Fundamentals
| General | |
| Distribution Yield | -- |
| Dividend Yield TTM (5-7-26) | 1.32% |
| 30-Day SEC Yield | -- |
| 7-Day SEC Yield | -- |
| Number of Holdings | 797 |
| Stock | |
| Weighted Average PE Ratio | 26.94 |
| Weighted Average Price to Sales Ratio | 5.585 |
| Weighted Average Price to Book Ratio | 6.940 |
| Weighted Median ROE | 89.46% |
| Weighted Median ROA | 10.27% |
| ROI (TTM) | 18.45% |
| Return on Investment (TTM) | 18.45% |
| Earning Yield | 0.0522 |
| LT Debt / Shareholders Equity | 1.189 |
| Number of Equity Holdings | 736 |
As of December 31, 2025
Growth Metrics
| EPS Growth (1Y) | 24.88% |
| EPS Growth (3Y) | 13.28% |
| EPS Growth (5Y) | 16.78% |
| Sales Growth (1Y) | 11.35% |
| Sales Growth (3Y) | 10.32% |
| Sales Growth (5Y) | 10.76% |
| Sales per Share Growth (1Y) | 17.54% |
| Sales per Share Growth (3Y) | 11.07% |
| Operating Cash Flow - Growth Rate (3Y) | 14.69% |
As of December 31, 2025
Fund Details
| Key Dates | |
| Inception Date | 11/12/2018 |
| Last Annual Report Date | 8/31/2025 |
| Last Prospectus Date | 12/31/2025 |
| Attributes | |
| Index Fund | -- |
| Inverse Fund | No |
| Leveraged Fund | -- |
| Fund of Funds |
|
| Currency Hedged Fund | -- |
| Socially Responsible Fund | No |
Top Portfolio Holders
| Name | % Weight |
|---|---|
| Portfolio A | 5.00% |
| Portfolio B | 3.50% |
| Portfolio C | 2.25% |
Excel Add-In Codes
| Name: =YCI("M:SPGEX", "name") |
| Broad Asset Class: =YCI("M:SPGEX", "broad_asset_class") |
| Broad Category: =YCI("M:SPGEX", "broad_category_group") |
| Prospectus Objective: =YCI("M:SPGEX", "prospectus_objective") |
| To find the codes for any of our securities and financial metrics, see our Complete Excel Reference. |