

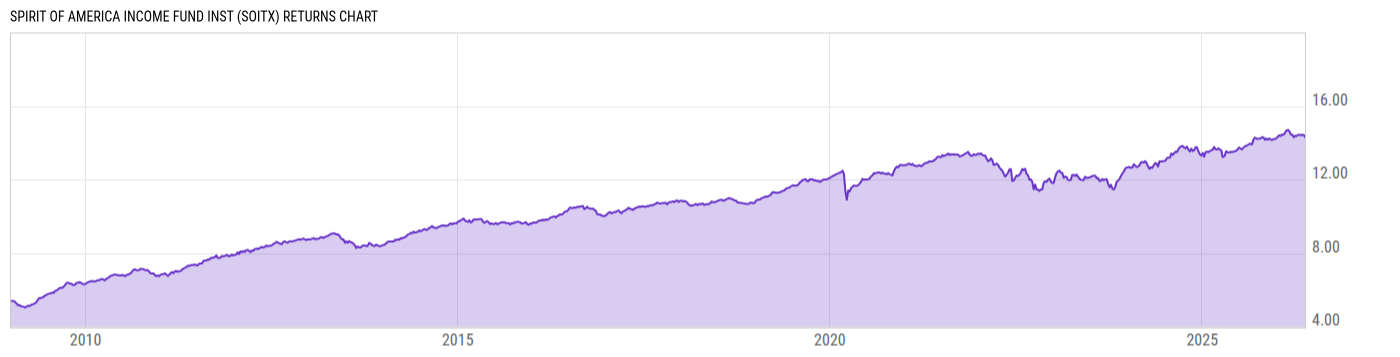
Spirit of America Income Fund Inst (SOITX)
9.97
+0.02
(+0.20%)
USD |
Jun 09 2026
Returns Chart
Key Stats
| Net Expense Ratio | Total Assets Under Management | Weighted Average Dividend Yield | Turnover Ratio (Generic) |
|---|---|---|---|
| 0.86% | 41.51M | -- | 2.00% |
| 1 Year Fund Level Flows | 1 Year Total Returns (Daily) | Annualized Total Returns Since Inception (Daily) | Max Drawdown (Since Inception) |
| -18.24M | 6.46% |
Basic Info
| Investment Strategy | |
| The Fund seeks high current income. The Fund seeks to achieve its investment objective by investing at least 80% of its assets in a portfolio of taxable municipal bonds, income producing convertible securities, preferred stocks, high yield U.S. corporate bonds and collateralized mortgage obligations. |
| General | |
| Security Type | Mutual Fund |
| Equity Style | -- |
| Broad Asset Class | Taxable Bond |
| Broad Category | Fixed Income |
| Global Peer Group | Bond USD |
| Peer Group | Multi-Sector Income Funds |
| Global Macro | Bond HC |
| US Macro | General Domestic Taxable Fixed Income Funds |
| YCharts Categorization | -- |
| YCharts Benchmark | -- |
| Prospectus Objective | Multi-Sector Income Funds |
| Fund Owner Firm Name | Spirit of America Investment Funds |
| Broad Asset Class Benchmark Index | |
| ^BBUSATR | 100.0% |
Net Fund Flows Versus Peer Group
1 Month
% Rank:
66
-144.76M
Peer Group Low
572.86M
Peer Group High
1 Year
% Rank:
72
-18.24M
-1.545B
Peer Group Low
30.94B
Peer Group High
3 Months
% Rank:
56
-480.71M
Peer Group Low
1.683B
Peer Group High
3 Years
% Rank:
66
-4.573B
Peer Group Low
71.08B
Peer Group High
6 Months
% Rank:
68
-777.58M
Peer Group Low
12.53B
Peer Group High
5 Years
% Rank:
63
-7.509B
Peer Group Low
61.00B
Peer Group High
YTD
% Rank:
65
-627.92M
Peer Group Low
8.773B
Peer Group High
10 Years
% Rank:
82
-13.91B
Peer Group Low
116.77B
Peer Group High
Date Unavailable
Risk
Performance Versus Peer Group
Annual Total Returns Versus Peers
As of June 10, 2026.
Asset Allocation
As of March 31, 2026.
| Type | % Net |
|---|---|
| Cash | 0.08% |
| Stock | 7.05% |
| Bond | 75.83% |
| Convertible | 0.00% |
| Preferred | 11.82% |
| Other | 5.22% |
Top 10 Holdings
| Name | % Weight | Price | % Change |
|---|---|---|---|
| TOBACCO SETTLEMENT FING CORP VA VA 6.706 06/01/2046 | 9.46% | 74.13 | -0.19% |
| KANSAS CITY MO SPL OBLIG MO 7.830 04/01/2040 | 5.65% | 114.17 | -0.09% |
| HEALTH CARE AUTH FOR BAPTIST HEALTH ALA AL 5.500 11/15/2043 | 4.40% | 94.02 | -0.18% |
| MetLife, Inc. MET 9.25 04/08/2068 FLT USD Corporate 144A '38 | 4.07% | 116.96 | 0.00% |
| MUNICIPAL ELEC AUTH GA GA 7.055 04/01/2057 | 3.51% | 109.88 | -0.19% |
| MetLife, Inc. MET 10.75 08/01/2069 FLT USD Corporate '39 | 3.00% | 128.81 | -0.47% |
| CUYAHOGA CNTY OHIO HOSP REV OH 8.223 02/15/2040 | 2.61% | 110.46 | -0.09% |
| PITTSBURGH & ALLEGHENY CNTY PA SPORTS & EXHIB AUTH COMWLTH LEASE REV PA 7.040 11/01/2039 | 2.48% | 102.90 | -0.09% |
| VIRGIN ISLANDS WTR & PWR AUTH ELEC SYS REV VI 6.850 07/01/2035 | 2.47% | 106.82 | -0.03% |
| PECO Energy Capital Trust IV EXC-PEnCa 5.75 06/15/2033 FIX USD Corporate | 2.29% | 97.00 | -0.35% |
Fees & Availability
| Fees | |
| Actual 12B-1 Fee | -- |
| Actual Management Fee | 0.47% |
| Administration Fee | 13.00% |
| Maximum Front Load | -- |
| Maximum Deferred Load | -- |
| Maximum Redemption Fee | -- |
| General Availability | |
| Available for Insurance Product | No |
| Available for RRSP | No |
| Purchase Details | |
| Open to New Investors |
|
| Minimum Initial Investment | 100000.0 None |
| Minimum Subsequent Investment | 10000.00 None |
Basic Info
| Investment Strategy | |
| The Fund seeks high current income. The Fund seeks to achieve its investment objective by investing at least 80% of its assets in a portfolio of taxable municipal bonds, income producing convertible securities, preferred stocks, high yield U.S. corporate bonds and collateralized mortgage obligations. |
| General | |
| Security Type | Mutual Fund |
| Equity Style | -- |
| Broad Asset Class | Taxable Bond |
| Broad Category | Fixed Income |
| Global Peer Group | Bond USD |
| Peer Group | Multi-Sector Income Funds |
| Global Macro | Bond HC |
| US Macro | General Domestic Taxable Fixed Income Funds |
| YCharts Categorization | -- |
| YCharts Benchmark | -- |
| Prospectus Objective | Multi-Sector Income Funds |
| Fund Owner Firm Name | Spirit of America Investment Funds |
| Broad Asset Class Benchmark Index | |
| ^BBUSATR | 100.0% |
Fundamentals
| General | |
| Distribution Yield | -- |
| Dividend Yield TTM (6-8-26) | 5.42% |
| 30-Day SEC Yield | -- |
| 7-Day SEC Yield | -- |
| Number of Holdings | 115 |
| Stock | |
| Weighted Average PE Ratio | -- |
| Weighted Average Price to Sales Ratio | -- |
| Weighted Average Price to Book Ratio | -- |
| Weighted Median ROE | -- |
| Weighted Median ROA | -- |
| ROI (TTM) | -- |
| Return on Investment (TTM) | -- |
| Earning Yield | -- |
| LT Debt / Shareholders Equity | -- |
| Number of Equity Holdings | 40 |
| Bond | |
| Yield to Maturity (3-31-26) | 6.45% |
| Effective Duration | -- |
| Average Coupon | 6.80% |
| Calculated Average Quality | 3.542 |
| Effective Maturity | 11.72 |
| Nominal Maturity | 20.74 |
| Number of Bond Holdings | 63 |
As of March 31, 2026
Growth Metrics
| EPS Growth (1Y) | -- |
| EPS Growth (3Y) | -- |
| EPS Growth (5Y) | -- |
| Sales Growth (1Y) | -- |
| Sales Growth (3Y) | -- |
| Sales Growth (5Y) | -- |
| Sales per Share Growth (1Y) | -- |
| Sales per Share Growth (3Y) | -- |
| Operating Cash Flow - Growth Rate (3Y) | -- |
As of March 31, 2026
Top Portfolio Holders
| Name | % Weight |
|---|---|
| Portfolio A | 5.00% |
| Portfolio B | 3.50% |
| Portfolio C | 2.25% |
Excel Add-In Codes
| Name: =YCI("M:SOITX", "name") |
| Broad Asset Class: =YCI("M:SOITX", "broad_asset_class") |
| Broad Category: =YCI("M:SOITX", "broad_category_group") |
| Prospectus Objective: =YCI("M:SOITX", "prospectus_objective") |
| To find the codes for any of our securities and financial metrics, see our Complete Excel Reference. |